 Facebook
 Twitter
 Pinterest
 Copy Link
First Quarter 2015 Pierce County Housing Report
We appear to be in for a wild ride in 2015 when it comes to the Pierce County Housing Market! So how do you navigate it if you are a seller?! What are the best strategies for a Buyer to get the home they really want? I'll discuss that and more in this article but as always let's start with the Pierce County numbers as of March 31st.
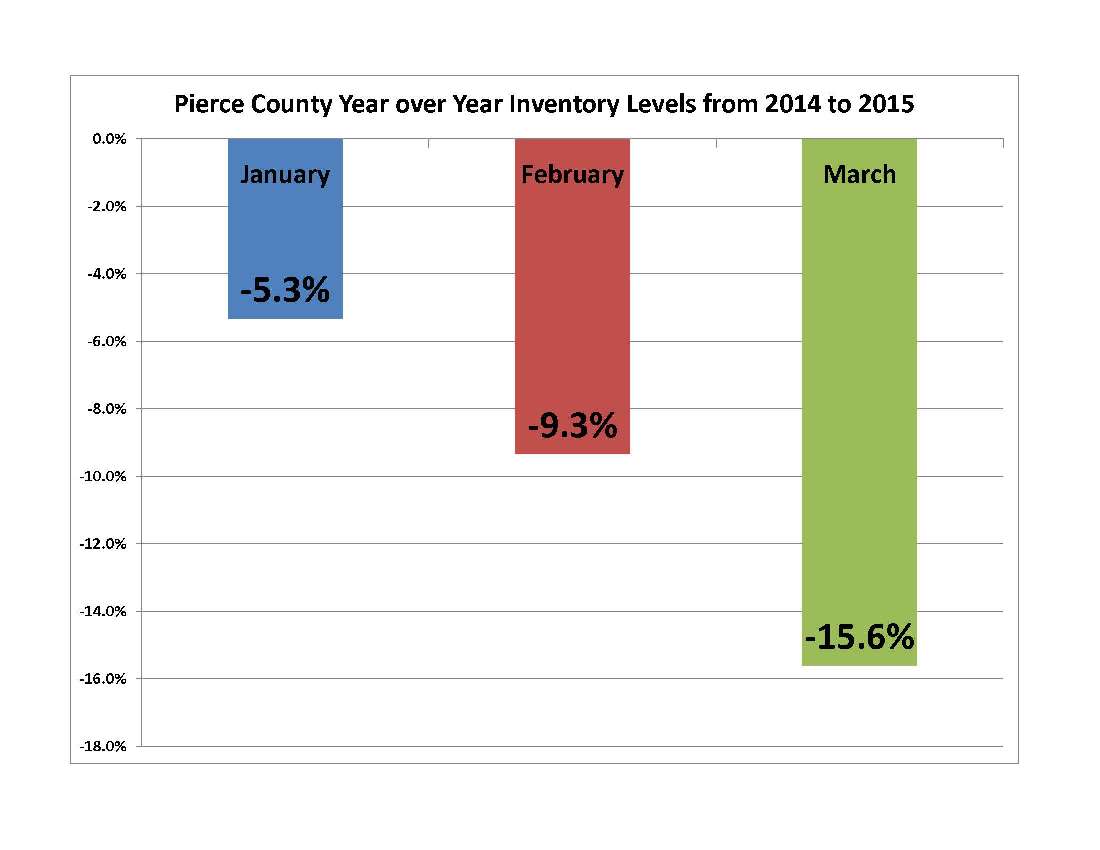
Inventory – DOWN – 15.6%
Closings – UP – 13.1%
Median Price – UP – 8%
New Pending Contracts – UP – 53.7%
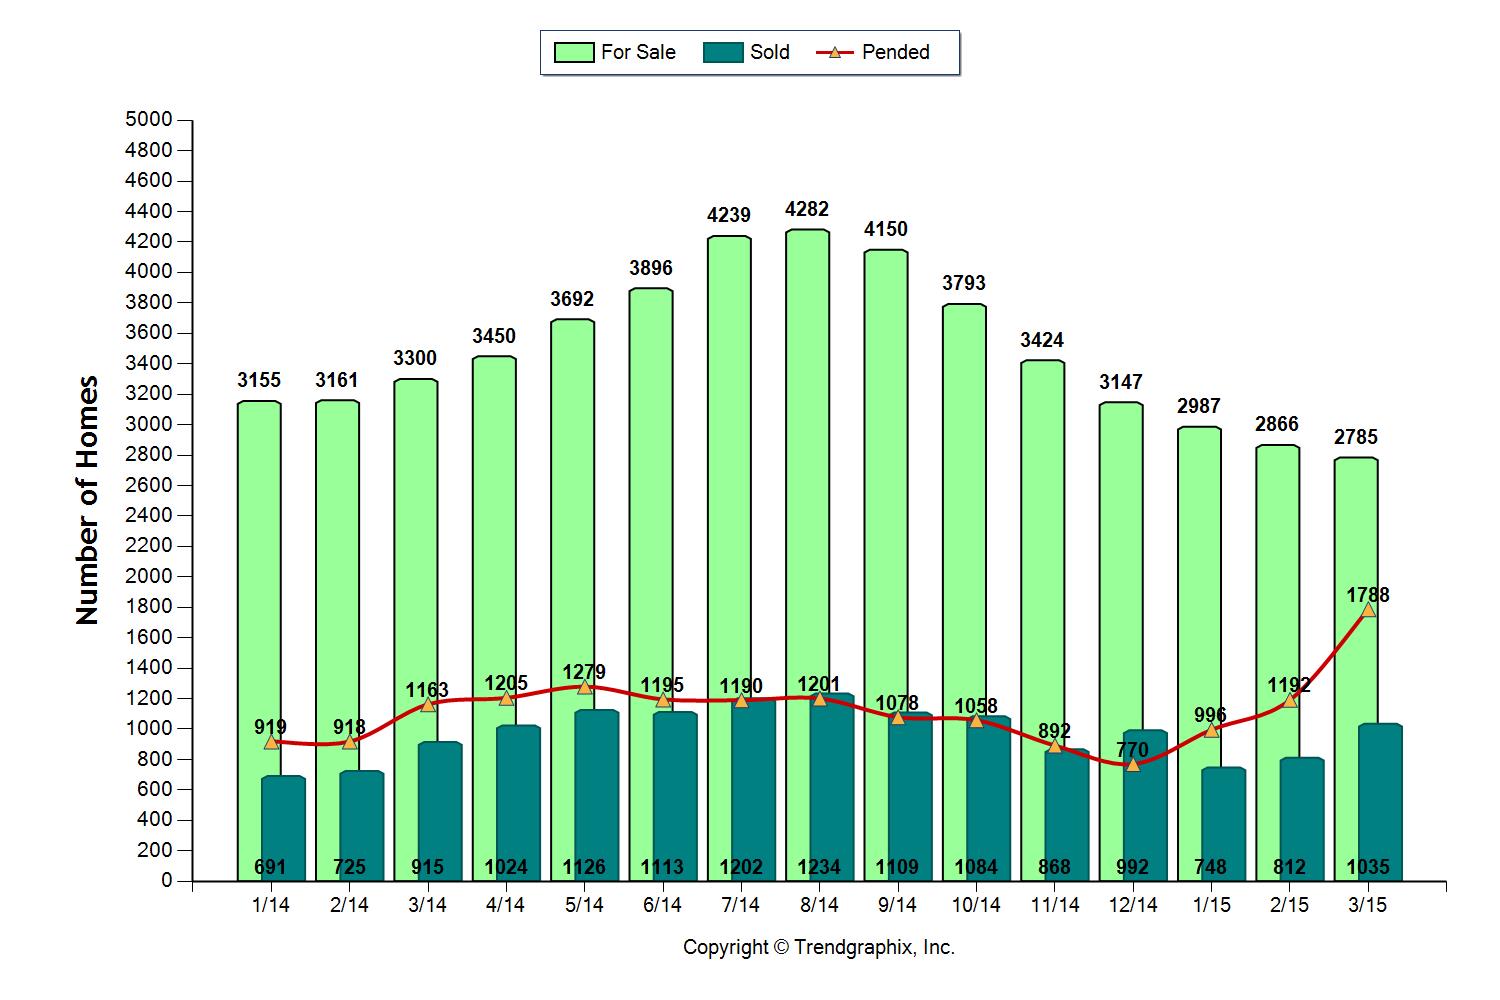
These Year over Year numbers tell us the market is hot, in fact the Months of Inventory (MOI) is at 2.7 based on last month's closed sales. This is the lowest since Q3 of 2005. Anytime the month's worth of inventory dips below 3 months we have a market environment that favors sellers and encourages price appreciation. Also, year over year inventory levels have been declining steadily in Pierce County so far this year.
The primary reason for these dramatic declines comes as no surprise…Pierce County home buyers have been busy! There may not have been much snow in the NW mountains this year but our Pending home sales chart looks like a ski jump with Pending sales up 33% for Q1! Inventory is the biggest key to how our market plays out for the balance of 2015.
So inventory is down and sales volume is rocketing. "If I want to sell my house I can ask whatever I want and buyers will flock to my door…right?!?" Not so fast! The answer is…."It depends". Turns out, like so many things in the world of statistical sound bites, there are some distinct differences in the experience you can expect as a buyer or seller depending on what price range you are in. Bear with me as I set this up.
There are 2 data points when evaluating a market that are, IMHO, the most valuable predictors of what to expect as a buyer or a seller. One is the Sales Ratio; I explained the Sales Ratio in a blog last year, if you want to refresh you can link to it here . In a nutshell 55% is a balanced market, the higher the sales ratio number, the hotter the market, and the more likely things are in favor of the seller. The second number is Months of Inventory (MOI), with this indicator the lower the number, the more likely is that sellers are in control. Low MOI says at the current sales pace the market will "run out" of inventory if new properties don't come available or demand slows down.
Overall PC has a sales ratio of 64% and MOI of 2.7. Both numbers tip in favor of sellers. Combined with the trends discussed in my opening remarks you'd think it's time for prices to move higher across the board. If you are working with homes under $500,000 you'd be absolutely right..you may even be accused of understating the situation, but if the home is over $500,000 it may require a closer examination. Take a look at the following;
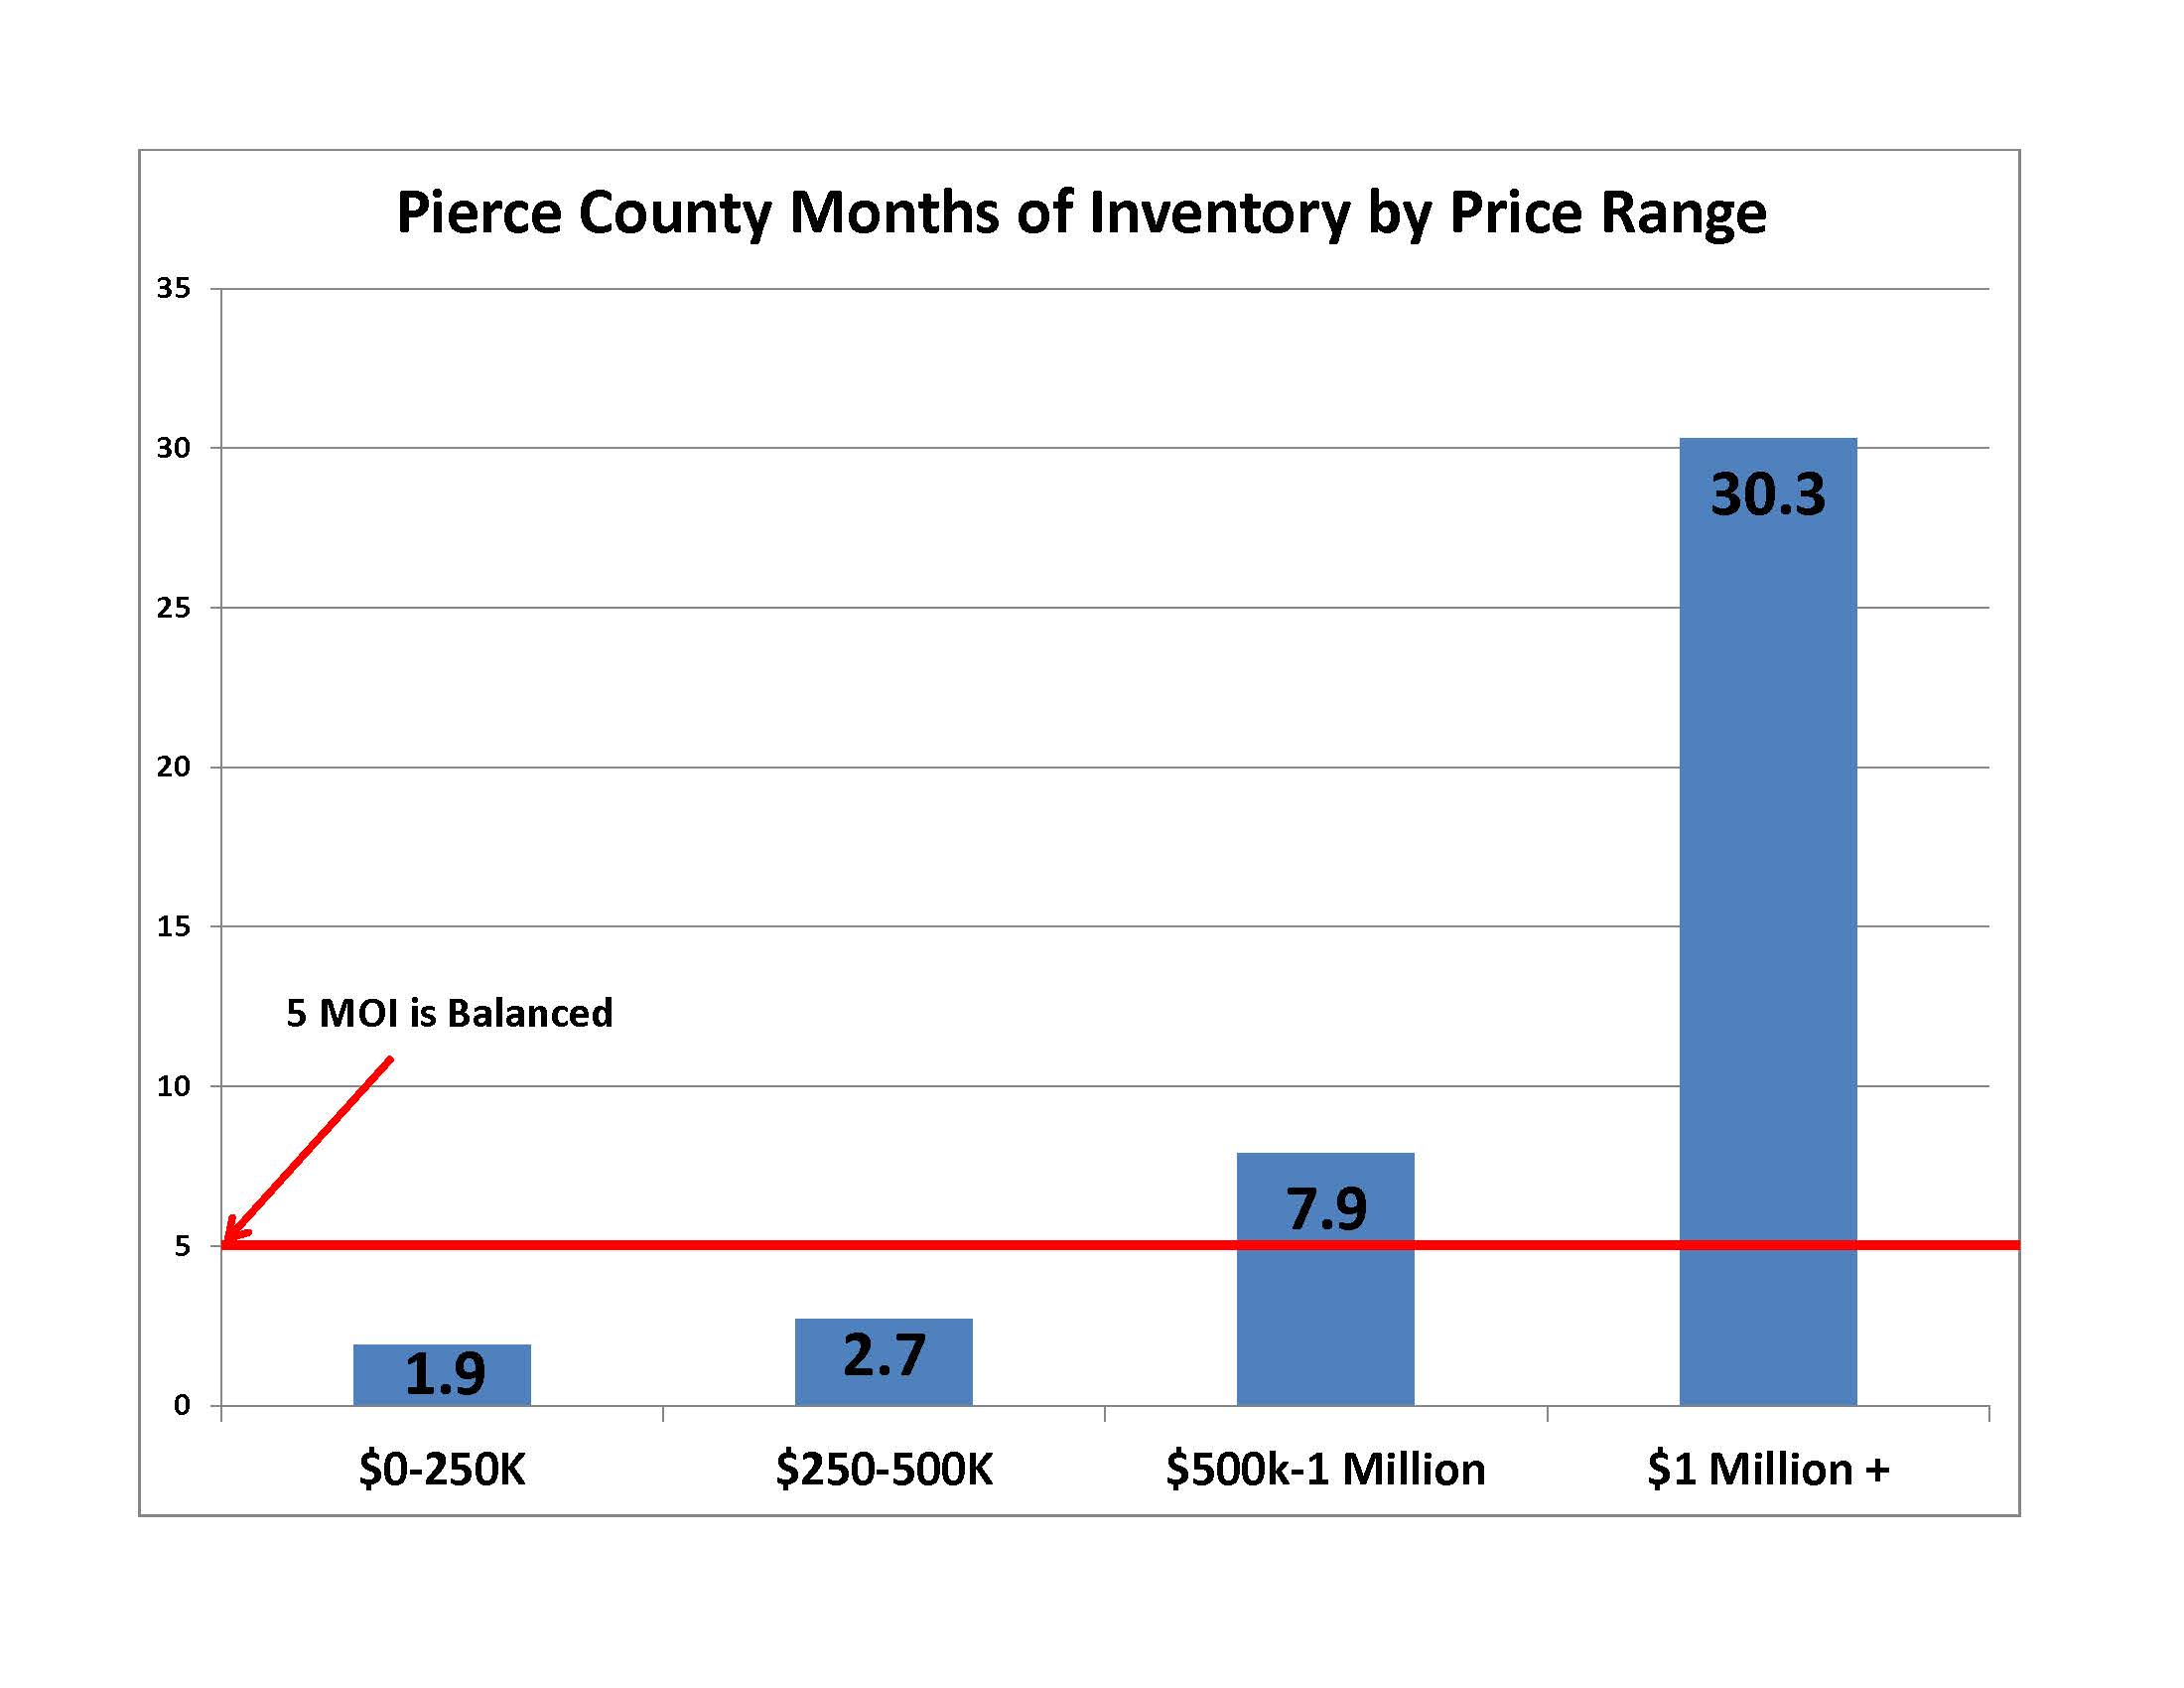

Millennial buyers, first time buyers, investors, and more are super heating the market under $250,000. I would argue that a 90% sales ratio is not even sustainable, prices have to increase to temper the demand and allow the inventory level of only 1.9 months supply to eventually come back in line. A buyer in this price range needs to choose a broker well networked and steeped in local knowledge. One that is plugged into technology that receives quick market alerts and is accessible; able to move quickly for you when good properties come available. In this price range the broker needs to be able to advise you on how to groom your offer for greater likelihood of acceptance without giving away important rights you need as a buyer and ensuring your transaction is financially safe.
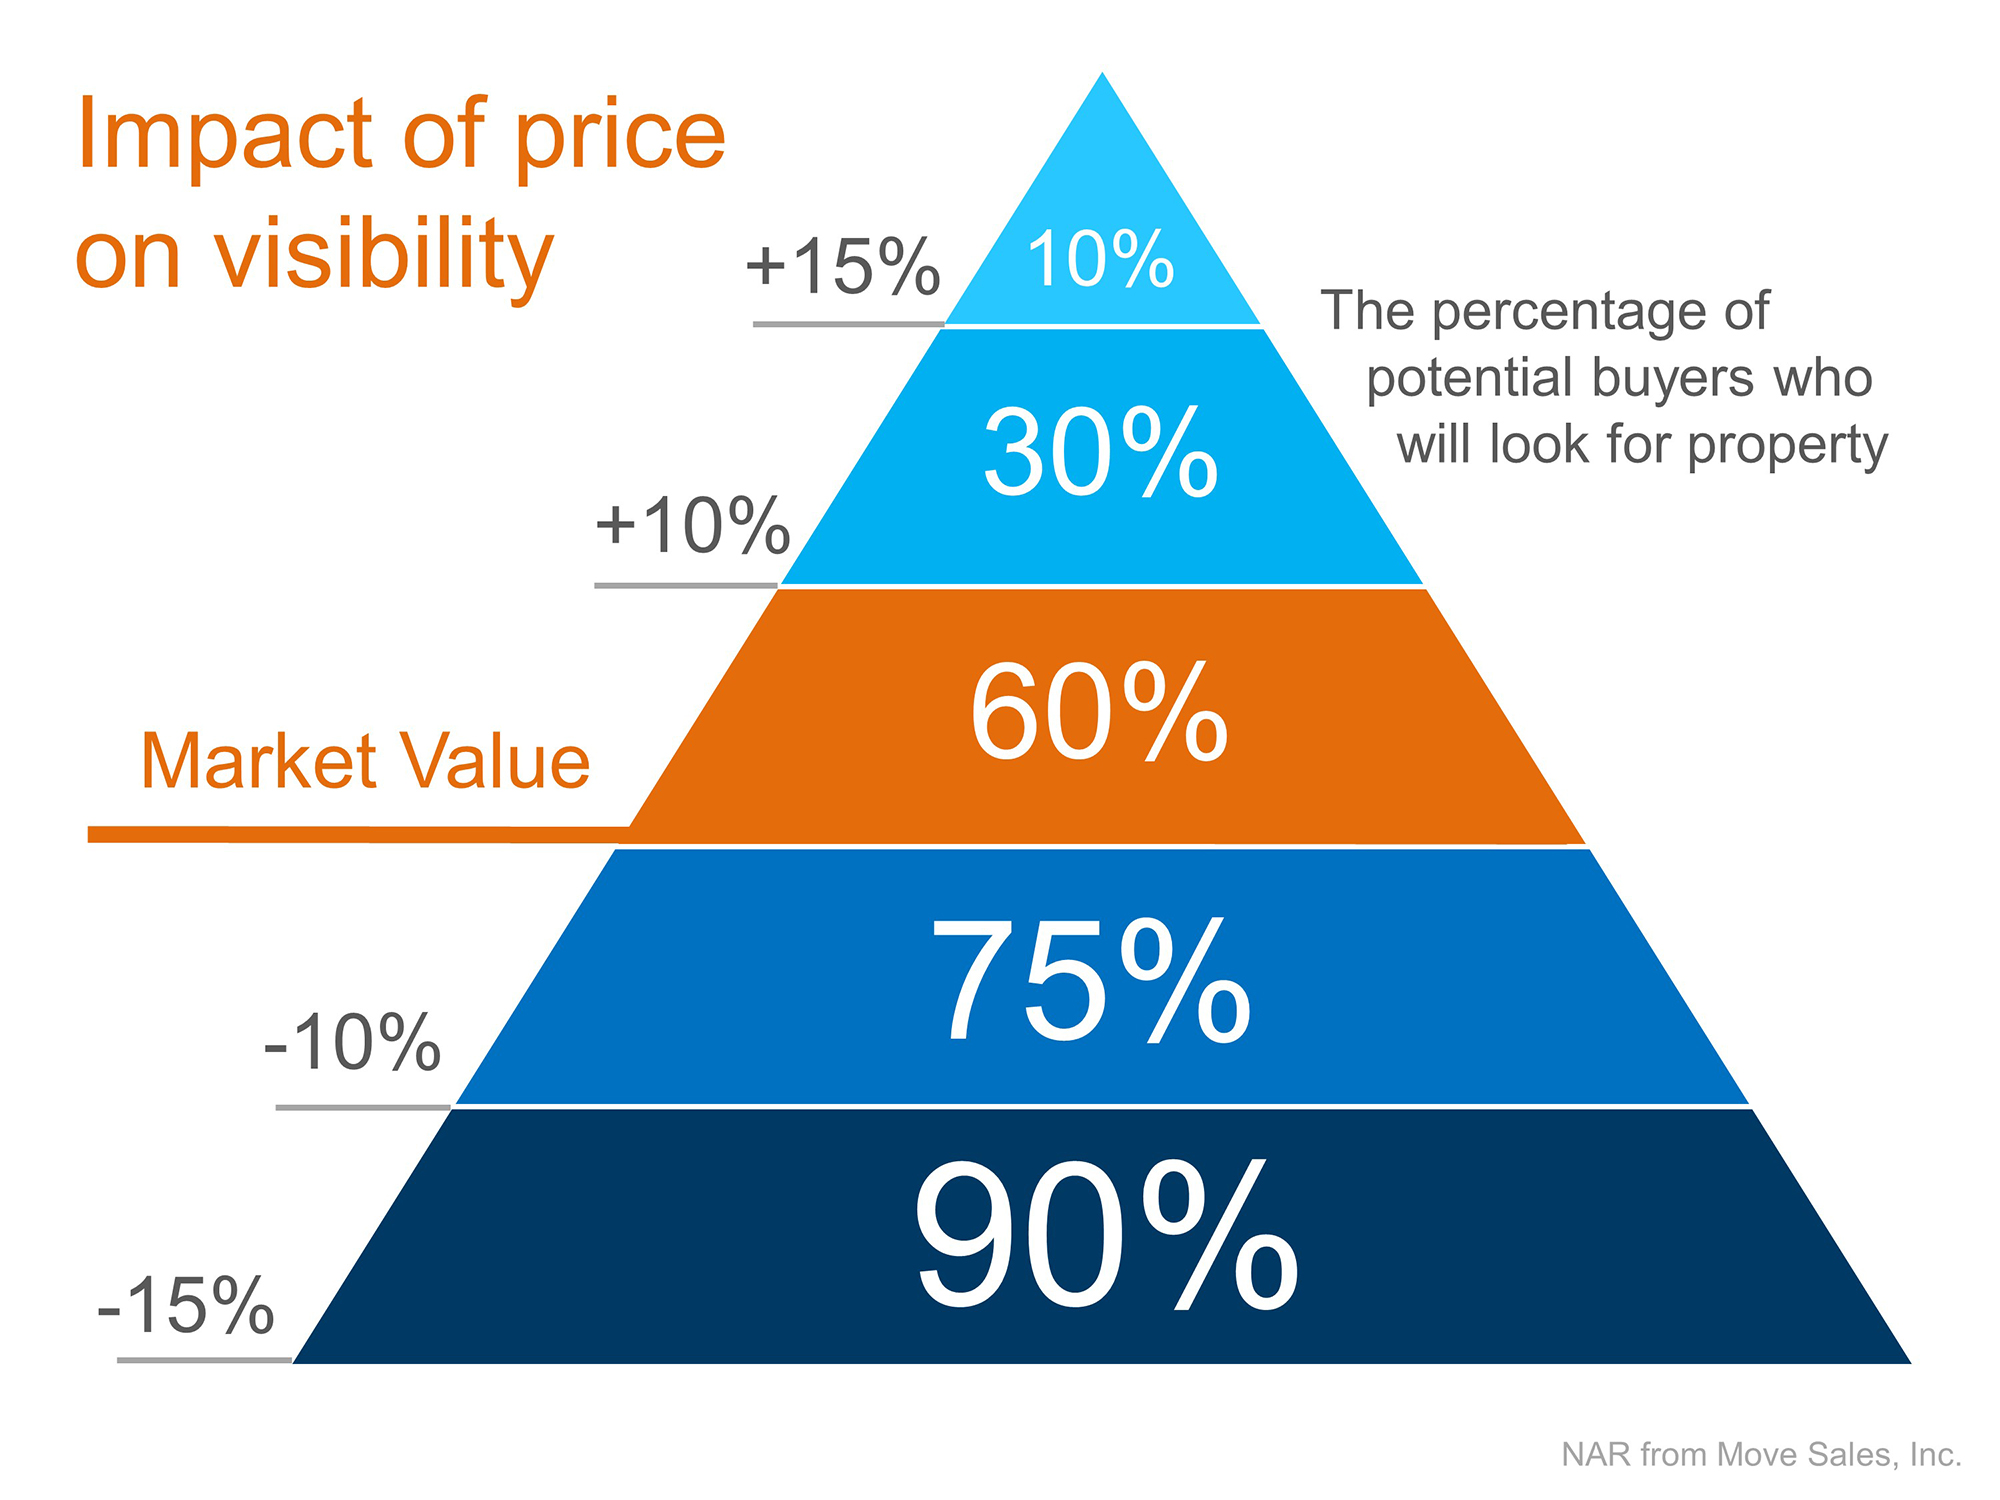
Conversely, between $500,000 and $1,000,000 a 21% Sales Ratio and almost 8 months of inventory is not a market condition that pushs prices up. Sellers here need to carefully evaluate their pricing strategy based on sound data that their broker can provide. If the Pierce County home is in the higher end, they are likely entering a market crowded with competition and it is worth considering the Impact of Price Visibility as shown on this chart;
The other take away I see in these numbers is the fact that if you're worried about finding your new dream home after selling the one you're in now, it may not be a concern if you are moving up into a larger or more deluxe dwelling.
In this ever dynamic market, sound professional advice and guidance is key to your real estate success. One newspaper or newscast headline does not fit all, and without local expertise with real time data it is easy to mis-step in such a fast paced real estate market.
Post Summer 2014 Pierce County Housing Report
Evidence of Slowing Appreciation and Reversion to Normalcy.
Also, how King County's trending may soon affect our local market.
Markets Continually Seek Balance The Pierce County Housing market as measured by August 2014 numbers gives us a clear indication it is efficiently balancing and allowing home buyers and sellers to participate with predictable results.
Inventory – UP +11%
Closings – Down -02%
Pending Sales – UP +21%
Months of Inventory – UP last year +3.2 this year + 3.6
Median Price – UP +5%
 With inventory at 4,282 units it is the highest it has been all year. In fact it was December 2011 since we had that many homes for sale in Pierce County. At that time we were steadily coming off the crazy high level of inventory that was the result of the housing crisis which peaked in August of 2007 at 9,022 units for sale. So how much inventory should we have? To have a balanced market, we need 3-5 months worth of inventory. In the last 14 years, which includes pre and post bubble markets, Pierce County has sold an average of 11,766 homes per year. Using that average we have 4.4 months inventory. Pendings are up 21% as we close out the summer so we may exceed 12,000 units with a strong finish in 2014.
 The peak of the Pierce County price index was 7 years ago! It has taken a long time to work through the huge impact of the housing market spinning out of control. Prices fell consistently for 5 years until reaching bottom in February 2012 and as of this month we are 39% up from that low! We've seen peak inventory levels as mentioned above when we had as much as 12 months worth on inventory and we've seen shortages like in March of 2013 with only 2,800 units for sale. It is refreshing to be at or near a normal inventory level!

Our recovery experience is comparable to other parts of the country. This CoreLogic map shows the State of Washington still 10.8% below it's peak market levels compared to other parts of the country that are either fully recovered or, like hard hit Nevada, still down over 37%. Ouch! It's always a good idea to break the numbers down to more localized evaluation and in this case I can tell you Pierce County is still 18% below the peak. What's interesting is Pierce County is at the same price level as June of 2005 while King County is at June 2006. With King County that much closer to the all time high, doesn't it seem logical that more of those buyers will be exploring Pierce County?

The road ahead. The Home Price Expectation Survey is a nationwide panel of over 100 economists, real estate experts, and investment or market strategists. I like this report because it is not the opinion of just one market expert, but a cumulative average of over 100 experts. Their 3rd quarter report is out and the graph is posted here. If Pierce County continues to generally follow the pattern of the rest of the country we will see cumulative appreciation of over 18% by the end of year 2018. This would put the Pierce County median price at about $280,000.
If you're a buyer in this market you can make your purchase decision with confidence that you're making a good long term investment. If you're a seller it is nice to know there is a balanced market with predictable fundamentals and a pool of buyers you can strike a deal with!
Pierce County Real Estate continues to lag behind King County
The Pierce County real estate market continues to lag behind King County, but there is light at the end of the tunnel and values are approaching 2004 – 2005 levels. For more details see the full article that was on yesterday's front page of the News Tribune.
Thousands in Pierce County trapped in underwater mortgages
Spring 2014 Pierce County Housing Report
Normalization continues, look who's buying and selling!
And where are rates headed?
The Pierce County Housing Market as measured by April 2014 numbers looks pretty benign and one might be tempted to believe the national headlines that the market is slowing down. Not so fast! Here are the numbers followed by a look inside the data that might surprise you!
Inventory – UP +17%
Closings – Down -7%
Pending Sales – UP +4%
Months of Inventory – UP last year 3 this year 3.7
Median Price – UP 13%

The stats above are not too impressive, maybe indicating the Pierce County Housing Market is neutral, and in a sideways crawl. To be honest I thought the same at first, and that is why I didn't check in with my report last month (My apologies to the 4 of you that missed it! lol!). Sometimes the real story is inside the numbers.
Normalization of the Pierce County Housing Market is evident. With falling distressed sale transactions and a substantial increase in upper end price ranges. This tells the story of the return of repeat sellers willing to resume participation in the market. Take a look at the breakdown of Pierce County sales by price range and what jumps out is the spike on the $350,000 to $500,000 price range.
 Although the overall numbers are not showing the big year over year gains we watched for most of last year, we can safely observe the market is more balanced and not just fueled by first time buyers and investors. Look below at how the makeup of sales is trending as measured by April numbers.

No Surprise – Rates will be going up – but when? By the end of 2015 Fannie Mae projects mortgage rates will be 5% while Freddie Mac's projection is 5.7% and Mortgage Bankers Association is 5.3%. The consensus is unanimous as to the direction of rates, the question is when. If Freddie Mac is correct with their projections the graph below is what we can expect.
 You've heard it before – "Even a rate in the 5's is great when compared to historical levels" While this is true, I found the chart below helpful in providing perspective. It shows that rates affect the "cost" of housing. Significant shifts in how much a monthly payment costs a homeowner can happen with a swing in rates.
 Possibly the greatest buying opportunity of a generation that was created by the Great Recession will be something we all talk about in the future. How soon that day comes is yet to be determined but it is clear we are still in a great window of opportunity.
 Despite recent gains, Pierce County still remains 21% below the peak median price, couple that with rates in the 4's one can say that both the Price and the Cost of a new home are very attractive!


