 Facebook
 Twitter
 Pinterest
 Copy Link
Pierce County Housing Report 2016 Recap / 2017 Outlook
The U.S. economy is providing a very positive backdrop of low unemployment, new highs in the stock market, and housing appreciation is firmly on the march. Pierce County is also enjoying it’s share of good news and economic fortune, 2016 was a great year of continued recovery. Looking ahead, Pierce County has some serious considerations that will determine it’s future and the role it plays in our region’s economy. First, here are the end of year end numbers as measured December 31, 2016.
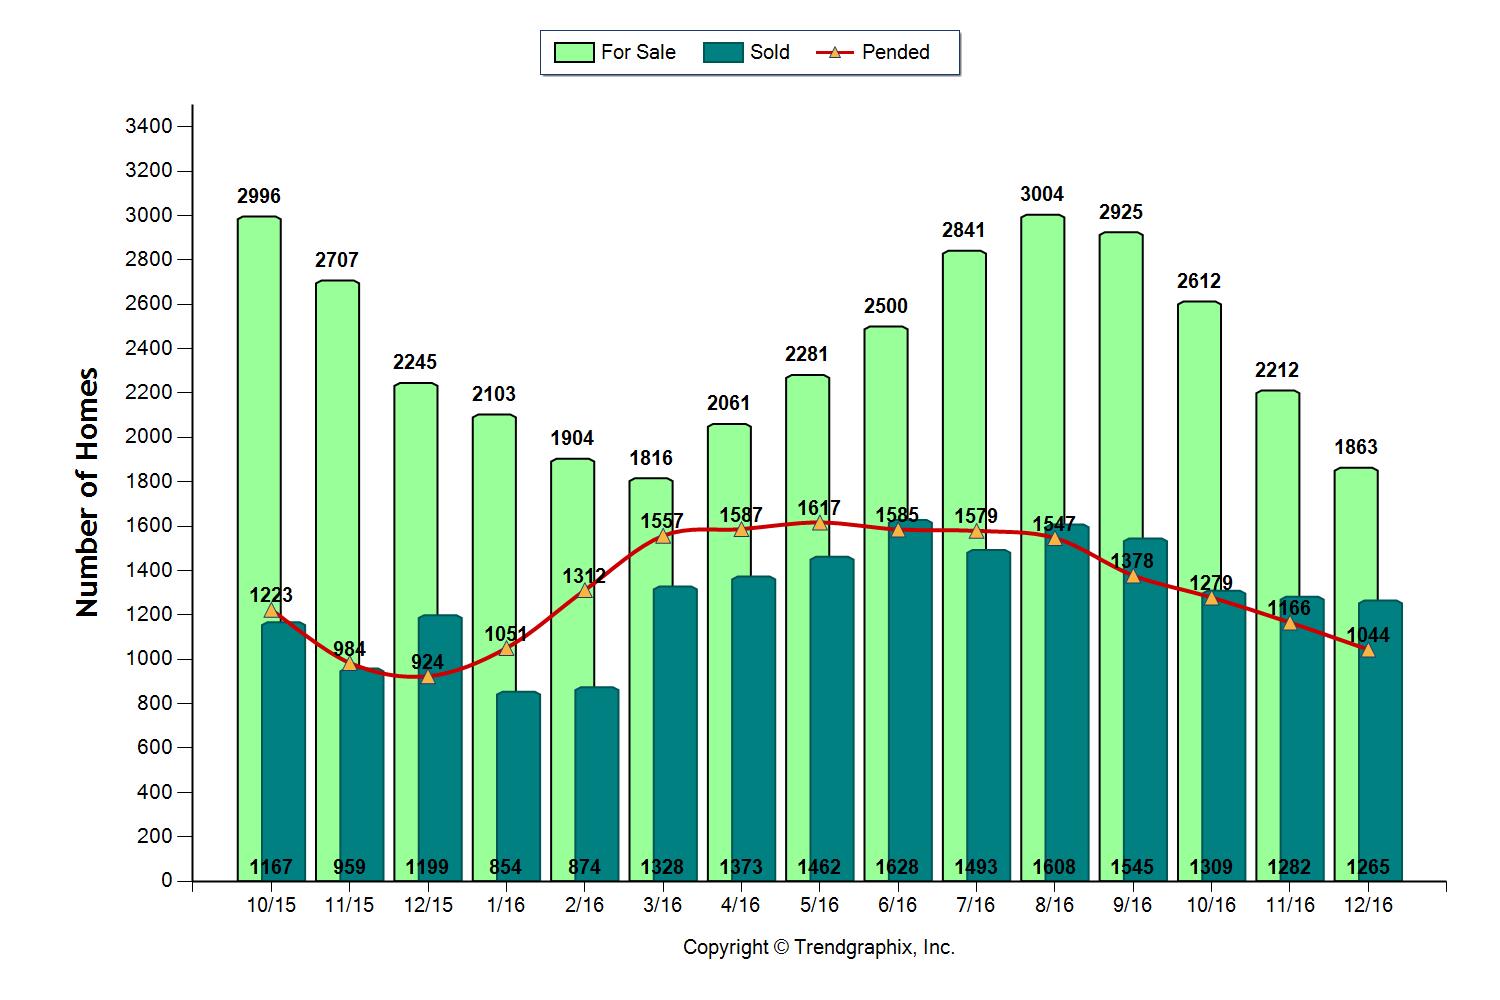
Inventory – DOWN – 17%
Closings – UP – 7.9%
Median Price – UP – 10.5%
New Pending Contracts – UP – 13.8%

Pierce County, by these numbers, has only 1.7 months worth of inventory. We consider 3-5 months worth of inventory to be a balanced market so there is clearly need of more homes to sell in order to satisfy current buyer demand.
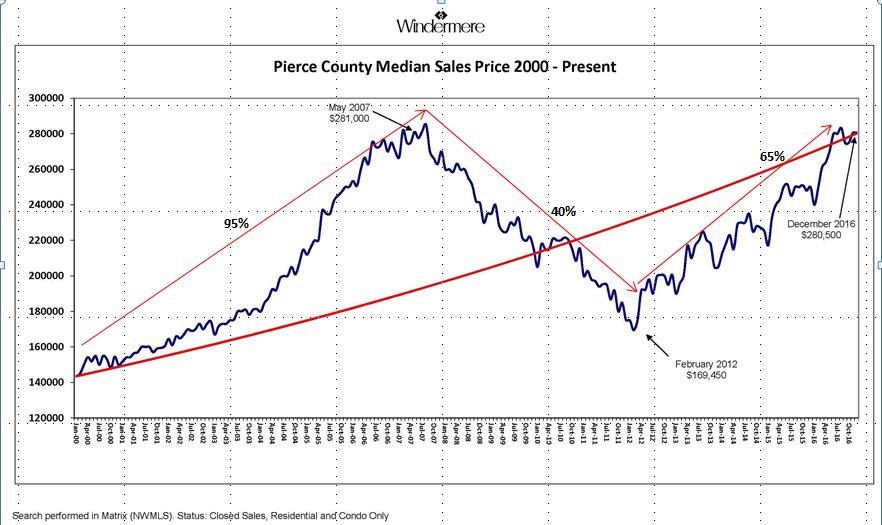
Prices in Pierce County are up 26% in the last 3 years (compounded rate of 8% annually) and the median price has fully recovered from the great recession.
As shown by our Pierce County Median Price Index we are at our pre-recession peak. By comparison, King County prices are 13% above their previous peak. The affordability index in Pierce is fully 45 points better than King County.
This recovery in price also means we have far fewer homeowners with negative equity. When a homeowner owes a mortgage balance greater than their home value they have negative equity. In 2011 & 2012 we were seeing negative equity rates in Pierce County upwards of 26% of all mortgages. Measured in the second quarter of 2016 the rate was a much improved 9.7%.
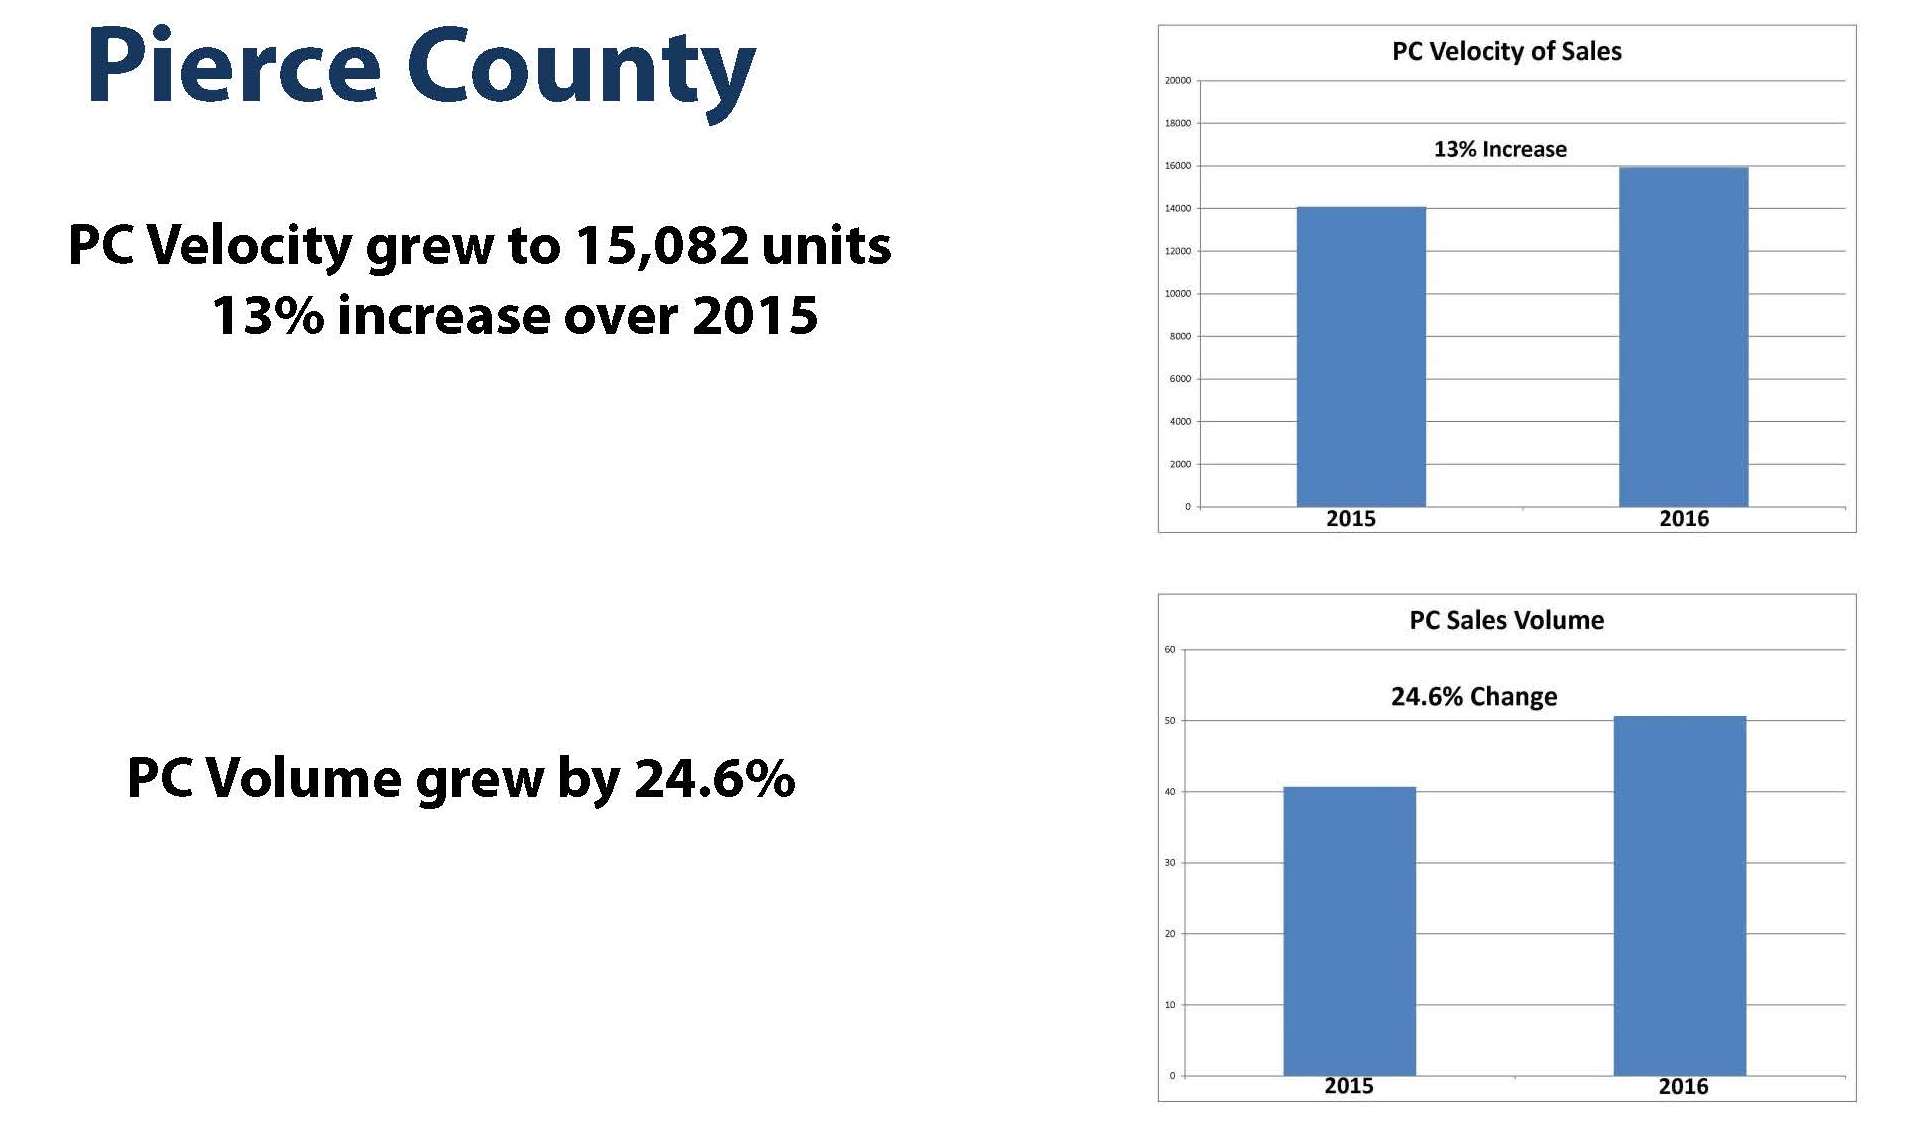
Price recovery is accompanied with Velocity and Volume recovery. Last year Pierce County sold 15,082 residential units representing a 13% increase over 2015. This amounted to just over 5 billion in sales and is expected to top 6 billion in 2017.
I feel bad clouding this good news with the following, but it clearly is an issue that is relevant to the health and future of our Pierce County Housing Market.
Here it is: Jobs, Jobs, Jobs.
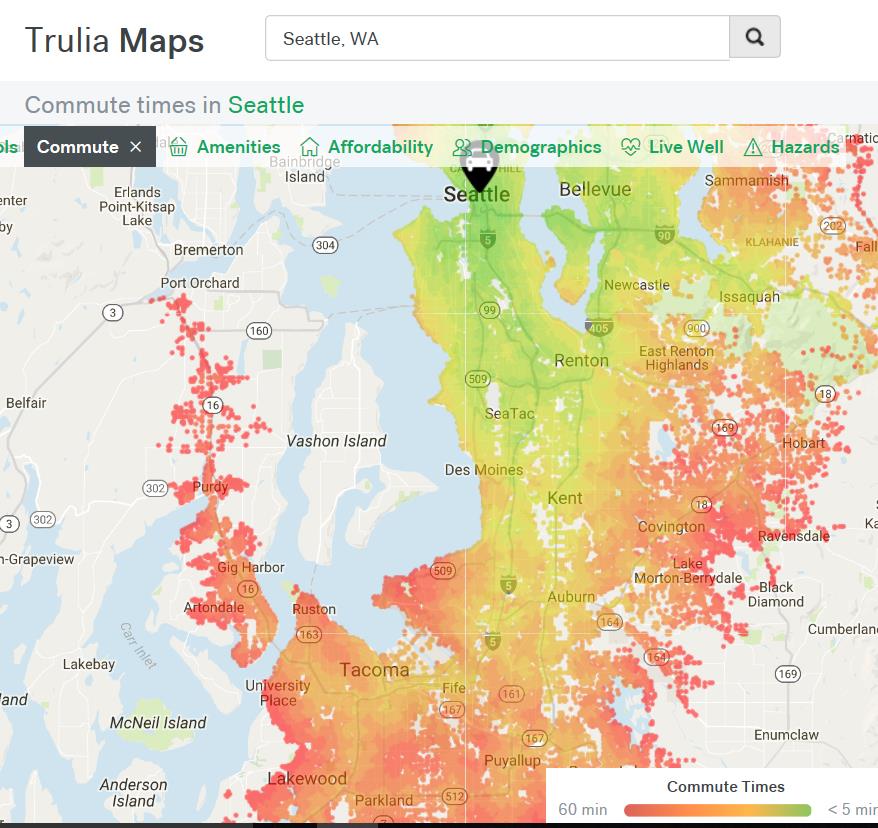
The King County market is red, no….white hot! Why? The King County number of jobs per resident is 207, in Pierce County the number of jobs per resident is 82. The unemployment rate in Seattle is 3.7% while in Pierce County it is 6%. Compare Pierce to U.S. with unemployment rate of 4.7% and see the weak recovery path in the graph below.
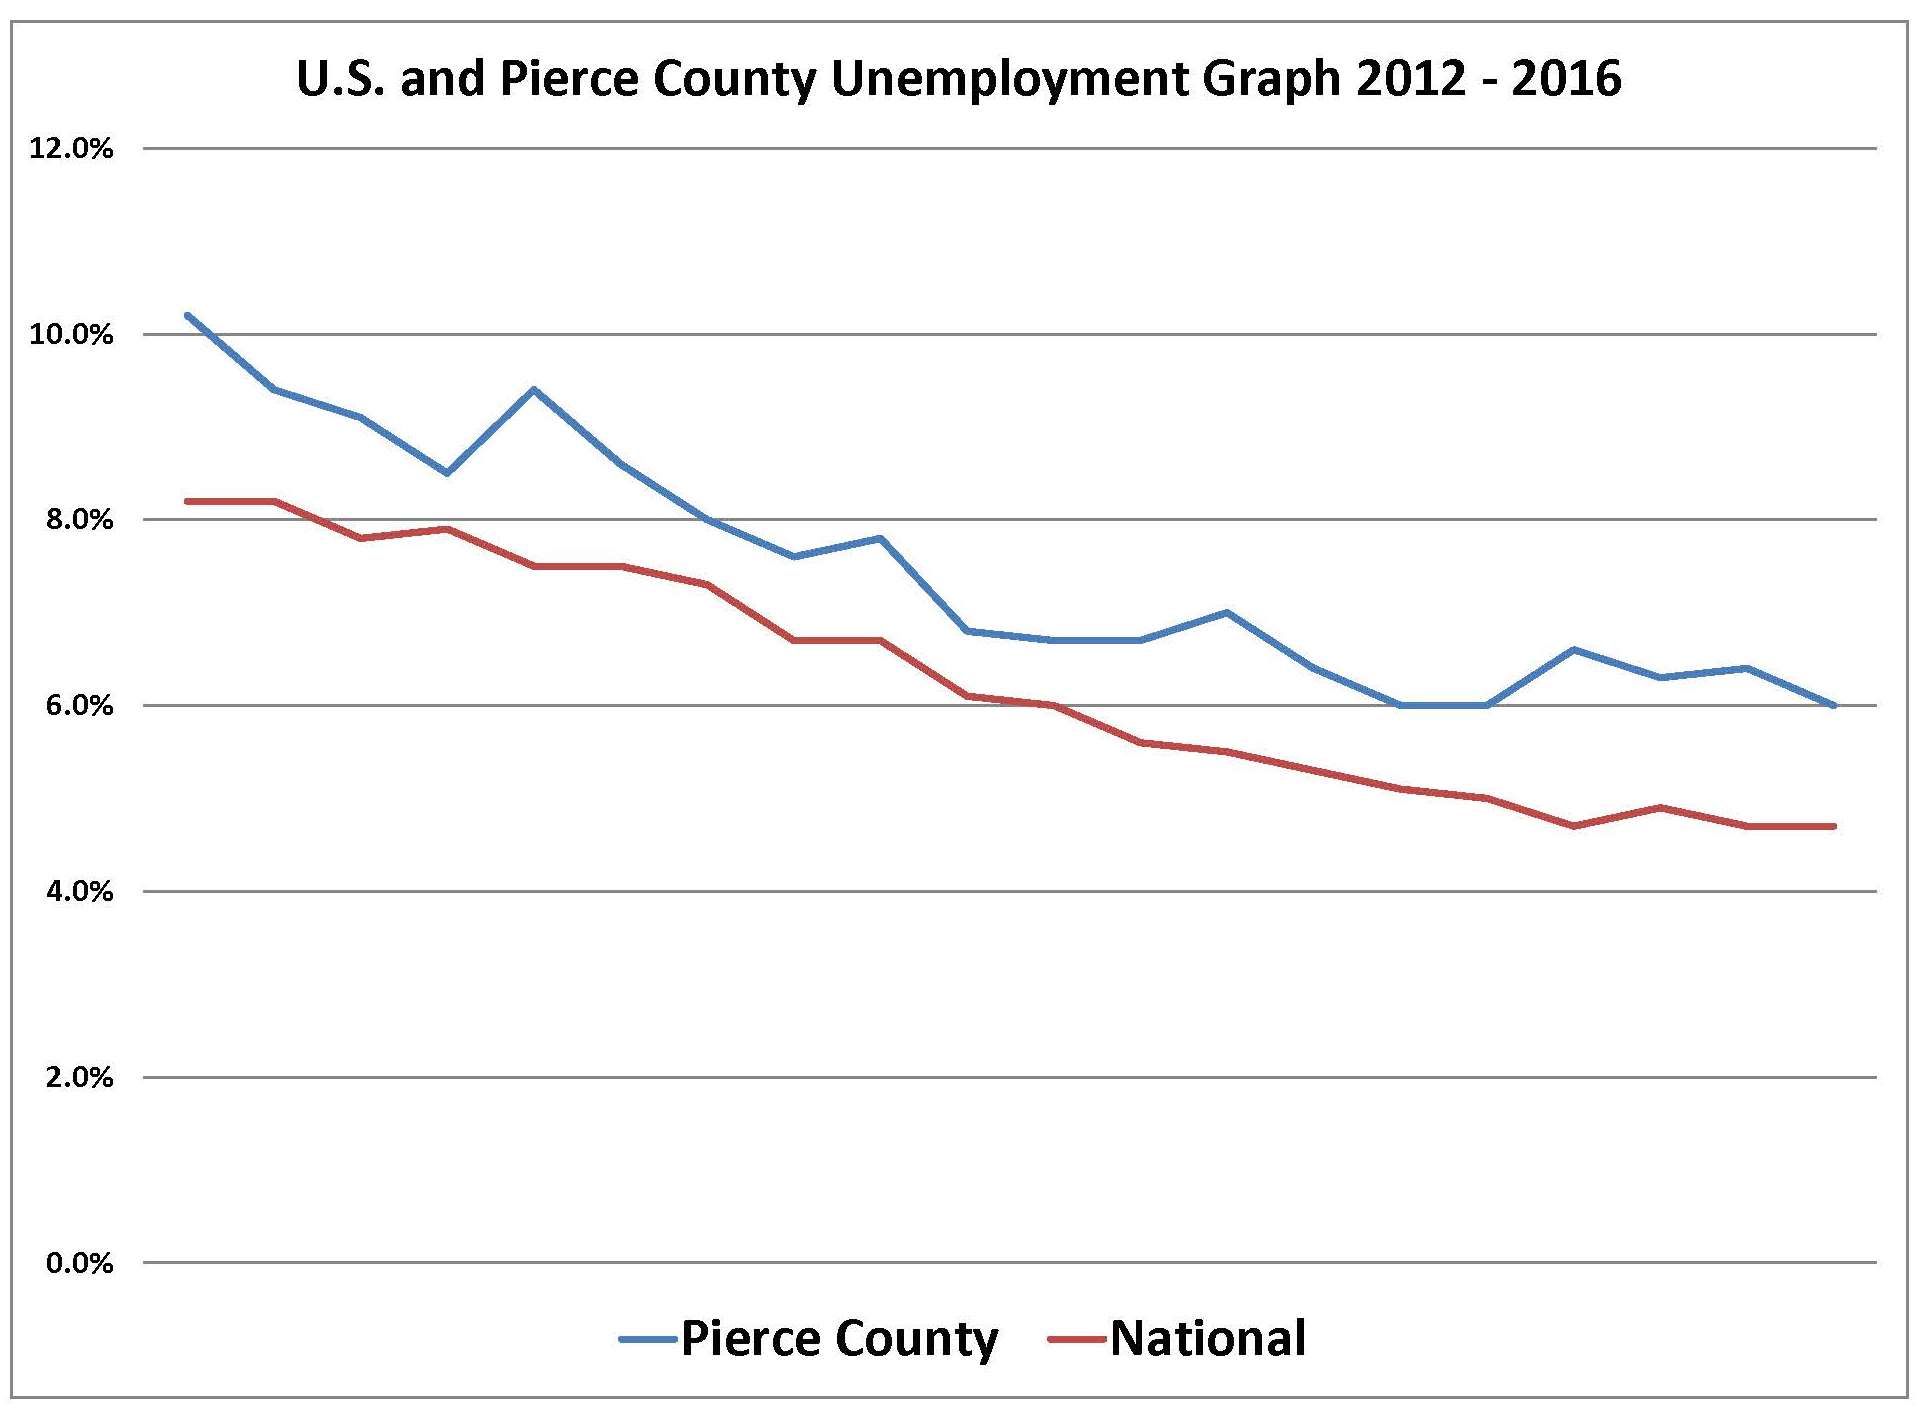
After each of the 3 previous recessions, Pierce County unemployment recovery was better. In the 90’s Pierce recovered to 4.5% unemployment, the pre-recession recovery was in the 5’s, while the current recovery has only reached 6% and it appears to be a post recovery low.
Pierce County’s per capital income is $45,000 and would not be that good were it not for King County jobs. We are fighting a trend of becoming a bedroom community.
Fully 135,000 Pierce County residents have jobs outside the county. Put another way, 40% of the non-military work force don’t work here.
The effect on real estate is the commuter buyer/renter is a big part of our market and will continue to be that way until Pierce County improves it’s workforce skill and attracts new businesses.
With the Pierce County shortage of inventory and the pressure of high prices in King County, homeowners in our area will enjoy another year of increased values, likely in the 9-10% range.
Buyers will need to be fully pre-approved, able to react quickly, and be open to the idea they will likely compete for their dream home.
Yes, it will be a good year for real estate in 2017, but there is work to do if Pierce County wants to be more than just a place for Seattle skilled workers and executives to come home and sleep until they can afford a home closer to their job.
October 2014 Pierce County Housing Report
It's that time again to check in on the Pierce County Housing Market. This month we have another neutral month based on the year over year stats I always lead off with, but I also found a few goblins we may want to keep an eye on. Here are the headline numbers as measured on September 30:
Inventory – UP 6.5%
Closings – UP 9.1%
Median Price – UP 1.4%
New Pending Contracts – 31.7%
These are Year Over Year Numbers and they look pretty good. Inventory is UP, we like that, the market needs more houses to sell as we still have less than 4 months supply based on closed sales. Median Price is UP only slightly but that's not a surprise, we talked last month about price increases slowing. Pending contracts are UP so much that it is a great indication we are in store for a strong sales flow during the 4th quarter as we wrap up 2014! While I prefer the pumpkin is "half full" viewpoint, I have to say the market hasn't "felt" like these numbers. When talking with other brokers recently, I've noticed some chatter about a slower market; so I dug a little deeper.
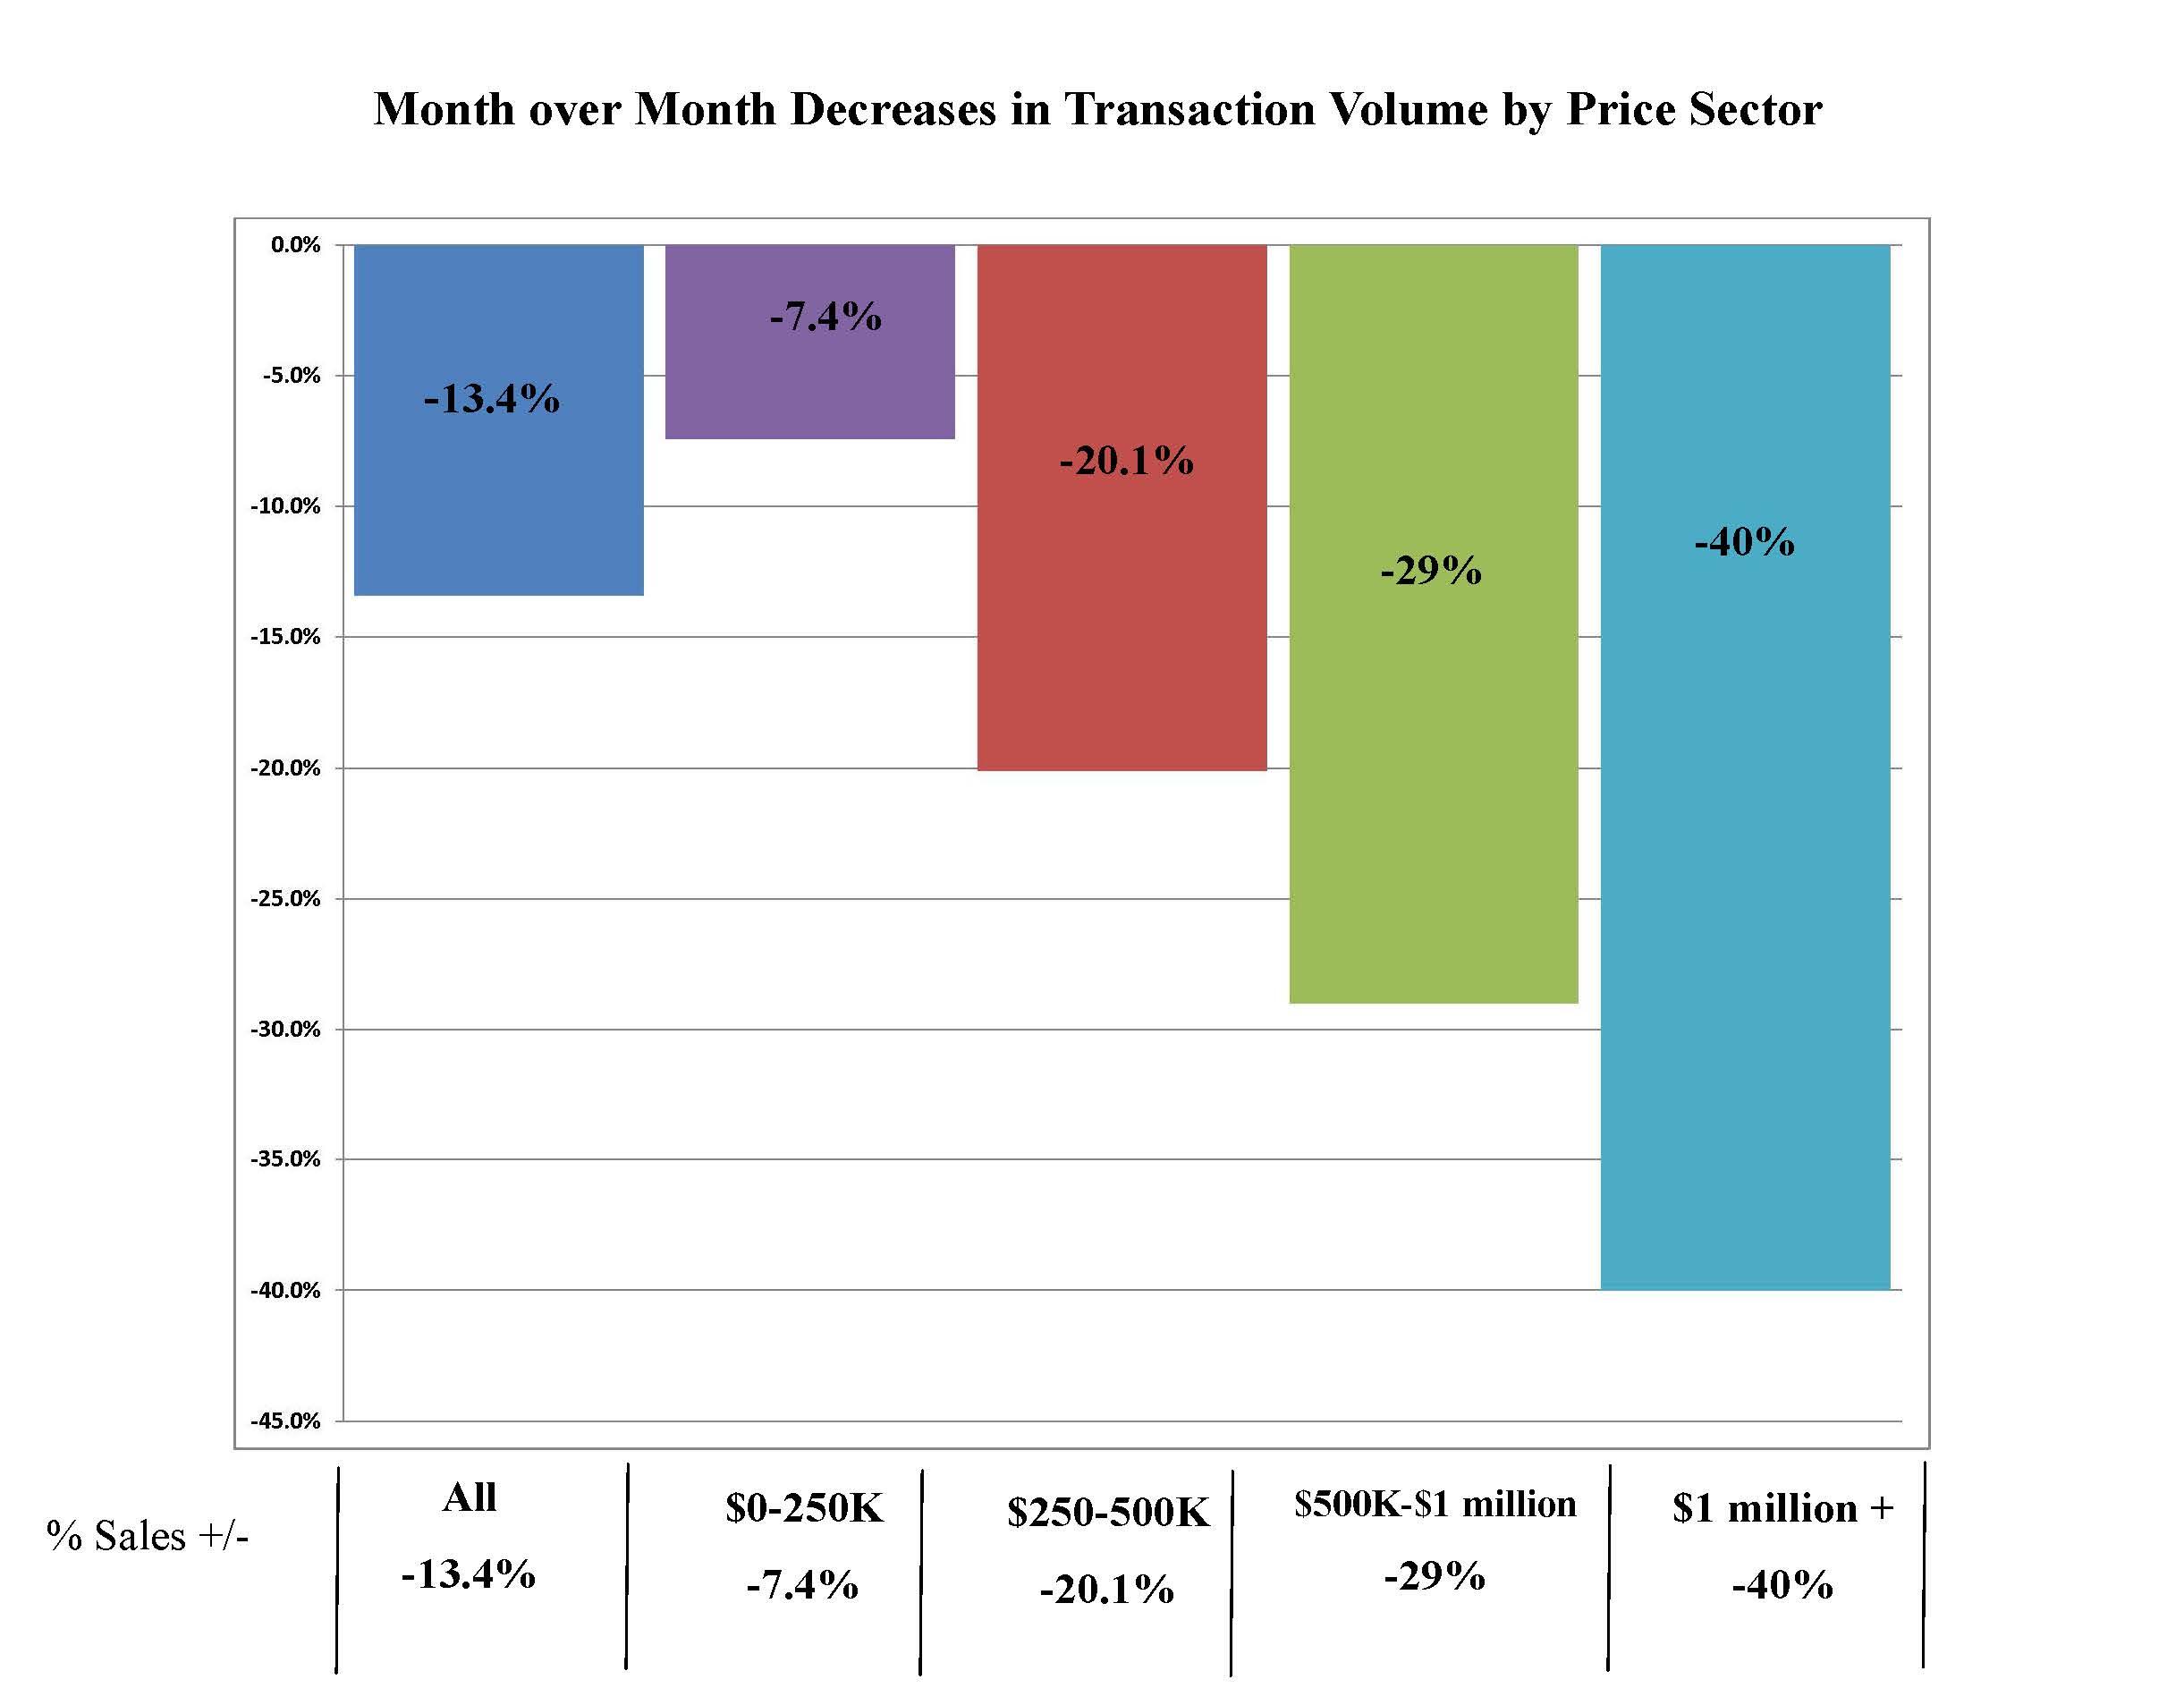
Month Over Month transaction volumes are much different with Pierce County DOWN 13.4%. Turns out this August vs September drop in closed sales is normal, at least compared to 2013 when the same thing happened. However in arriving at this conclusion I viewed the volumes by price range and saw a couple of items you may find interesting. In the chart above you can see the very important $250,000 – $500,000 price range things really took a break with volume dropping 20%. These are the homes that buyers are "moving up to" and it is just this year we have been able to say the recovery took hold in this sector. This segment of the market represents over 35% of our Pierce County transaction volume. I don't know if it is widely understood that 95.7% of the Pierce County Market happens in this price sector….and below!
![]()
This shows that only 4.4% of all Pierce County transactions were over $500,000. In case you were wondering, listing inventory over $500,000 disproportionately makes up 13.3% of the total number of homes for sale. Pierce County Housing Market participants need to know, the "Work-Horse" price sector is under $250,000 with 41% of the inventory creating over 60% of the sales!
We have a healthy volume of Pending Sales so if history repeats itself the coming months should provide a nice increase as we wrap up 2014.
September's numbers are a fitting reminder that there's a limit to how robust our recovery can be characterized.
Month by month we are achieving normalization and as I've always said; "markets don't recover in a straight line" so there may be a bump in the road from time to time. Those that approach this market with realistic expectations based on detailed market analysis will find success.
Give me a call or shoot me an email, it is always good to hear from you!
Spring 2014 Pierce County Housing Report
Normalization continues, look who's buying and selling!
And where are rates headed?
The Pierce County Housing Market as measured by April 2014 numbers looks pretty benign and one might be tempted to believe the national headlines that the market is slowing down. Not so fast! Here are the numbers followed by a look inside the data that might surprise you!
Inventory – UP +17%
Closings – Down -7%
Pending Sales – UP +4%
Months of Inventory – UP last year 3 this year 3.7
Median Price – UP 13%

The stats above are not too impressive, maybe indicating the Pierce County Housing Market is neutral, and in a sideways crawl. To be honest I thought the same at first, and that is why I didn't check in with my report last month (My apologies to the 4 of you that missed it! lol!). Sometimes the real story is inside the numbers.
Normalization of the Pierce County Housing Market is evident. With falling distressed sale transactions and a substantial increase in upper end price ranges. This tells the story of the return of repeat sellers willing to resume participation in the market. Take a look at the breakdown of Pierce County sales by price range and what jumps out is the spike on the $350,000 to $500,000 price range.
 Although the overall numbers are not showing the big year over year gains we watched for most of last year, we can safely observe the market is more balanced and not just fueled by first time buyers and investors. Look below at how the makeup of sales is trending as measured by April numbers.

No Surprise – Rates will be going up – but when? By the end of 2015 Fannie Mae projects mortgage rates will be 5% while Freddie Mac's projection is 5.7% and Mortgage Bankers Association is 5.3%. The consensus is unanimous as to the direction of rates, the question is when. If Freddie Mac is correct with their projections the graph below is what we can expect.
 You've heard it before – "Even a rate in the 5's is great when compared to historical levels" While this is true, I found the chart below helpful in providing perspective. It shows that rates affect the "cost" of housing. Significant shifts in how much a monthly payment costs a homeowner can happen with a swing in rates.
 Possibly the greatest buying opportunity of a generation that was created by the Great Recession will be something we all talk about in the future. How soon that day comes is yet to be determined but it is clear we are still in a great window of opportunity.
 Despite recent gains, Pierce County still remains 21% below the peak median price, couple that with rates in the 4's one can say that both the Price and the Cost of a new home are very attractive!


