 Facebook
 X
X
 Pinterest
 Copy Link
Pierce County Housing Report 2016 Recap / 2017 Outlook
The U.S. economy is providing a very positive backdrop of low unemployment, new highs in the stock market, and housing appreciation is firmly on the march. Pierce County is also enjoying it’s share of good news and economic fortune, 2016 was a great year of continued recovery. Looking ahead, Pierce County has some serious considerations that will determine it’s future and the role it plays in our region’s economy. First, here are the end of year end numbers as measured December 31, 2016.
Inventory – DOWN – 17%
Closings – UP – 7.9%
Median Price – UP – 10.5%
New Pending Contracts – UP – 13.8%

Pierce County, by these numbers, has only 1.7 months worth of inventory. We consider 3-5 months worth of inventory to be a balanced market so there is clearly need of more homes to sell in order to satisfy current buyer demand.
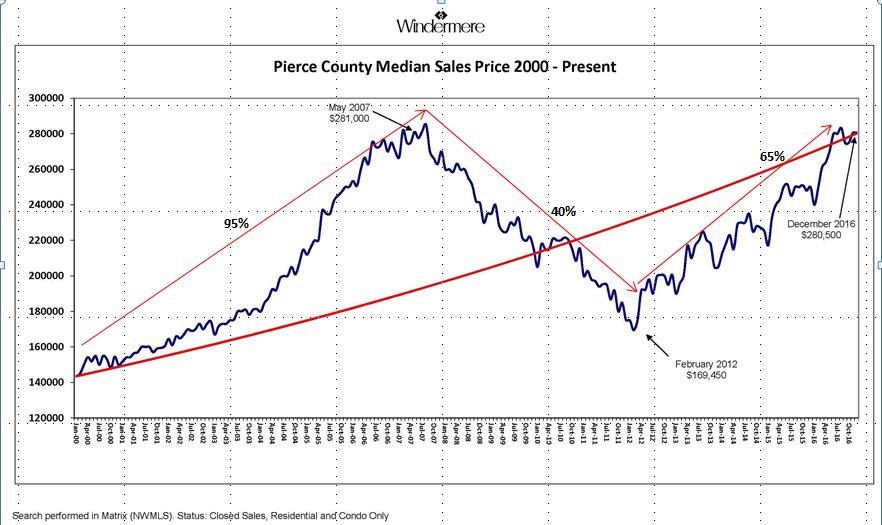
Prices in Pierce County are up 26% in the last 3 years (compounded rate of 8% annually) and the median price has fully recovered from the great recession.
As shown by our Pierce County Median Price Index we are at our pre-recession peak. By comparison, King County prices are 13% above their previous peak. The affordability index in Pierce is fully 45 points better than King County.
This recovery in price also means we have far fewer homeowners with negative equity. When a homeowner owes a mortgage balance greater than their home value they have negative equity. In 2011 & 2012 we were seeing negative equity rates in Pierce County upwards of 26% of all mortgages. Measured in the second quarter of 2016 the rate was a much improved 9.7%.
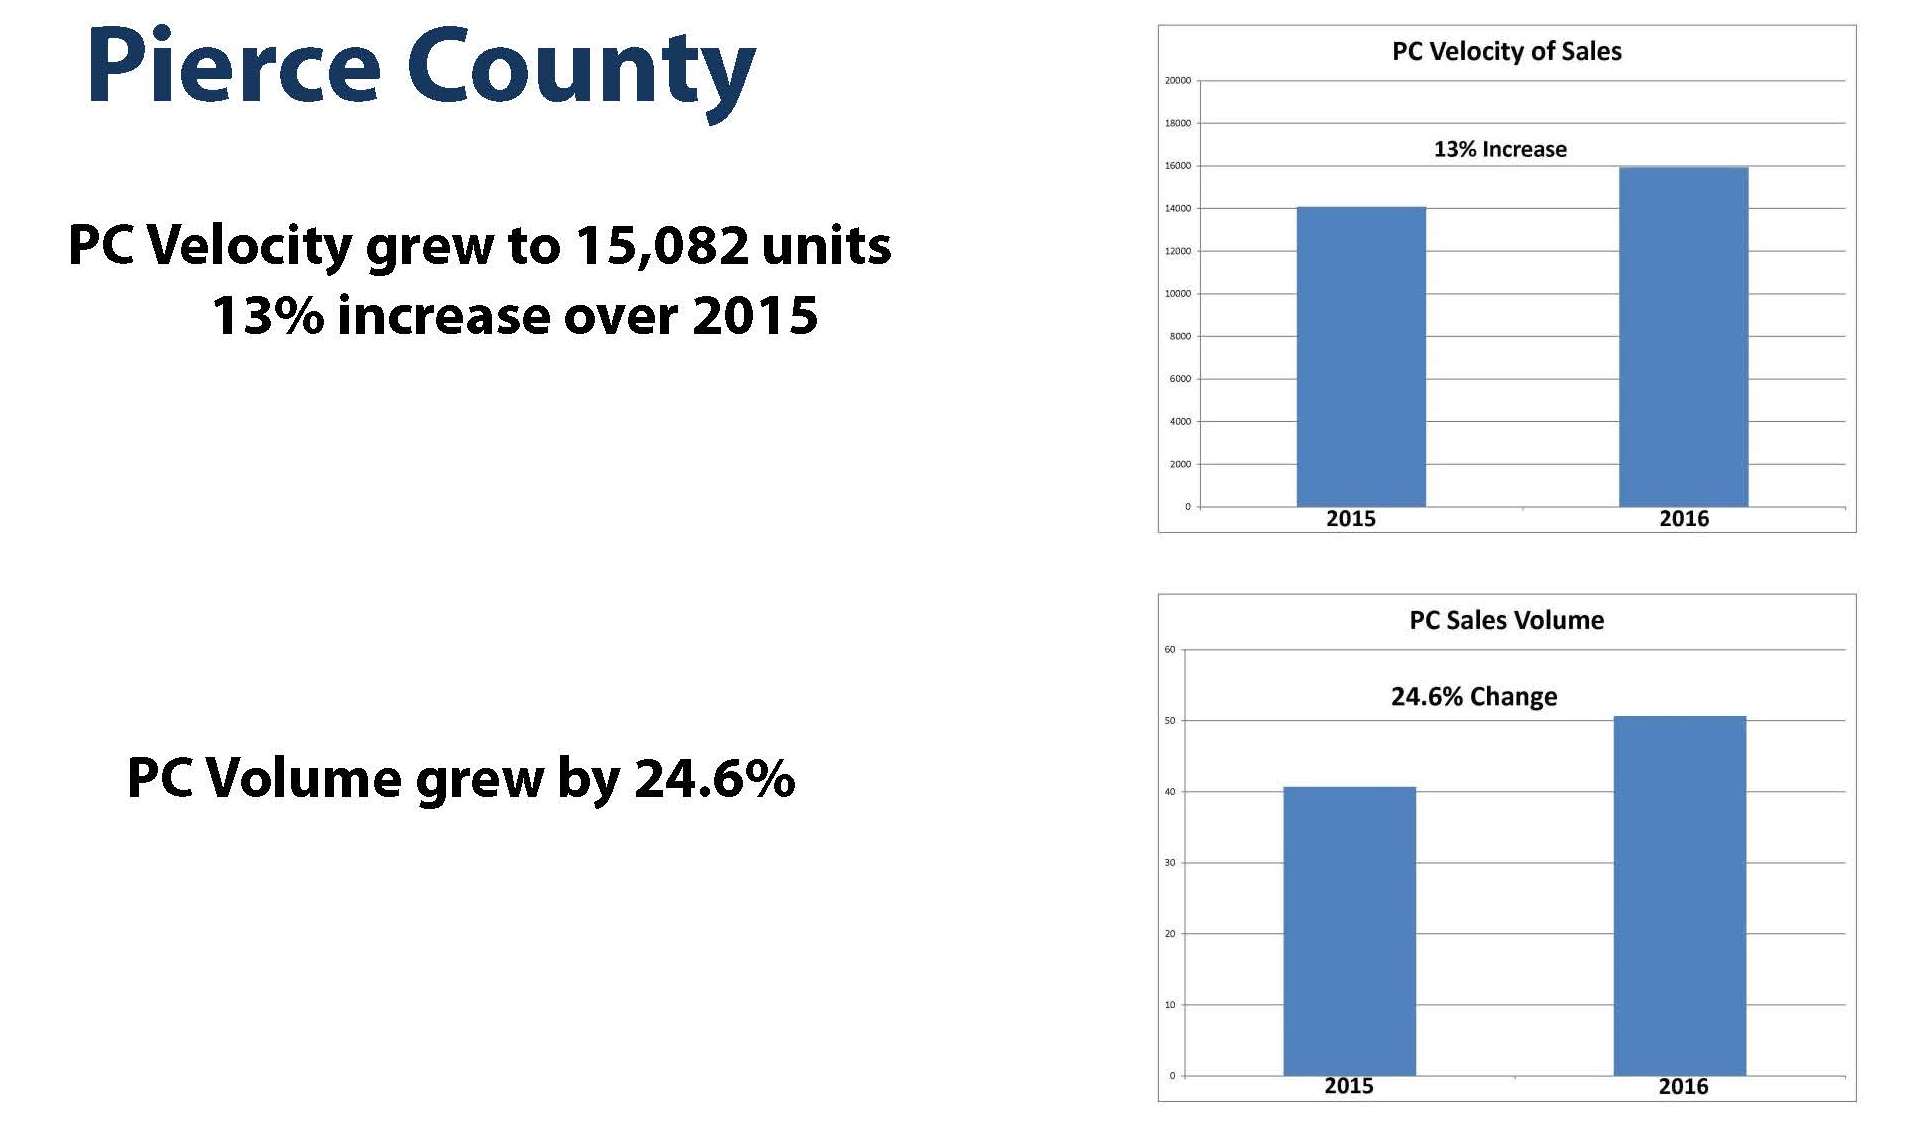
Price recovery is accompanied with Velocity and Volume recovery. Last year Pierce County sold 15,082 residential units representing a 13% increase over 2015. This amounted to just over 5 billion in sales and is expected to top 6 billion in 2017.
I feel bad clouding this good news with the following, but it clearly is an issue that is relevant to the health and future of our Pierce County Housing Market.
Here it is: Jobs, Jobs, Jobs.
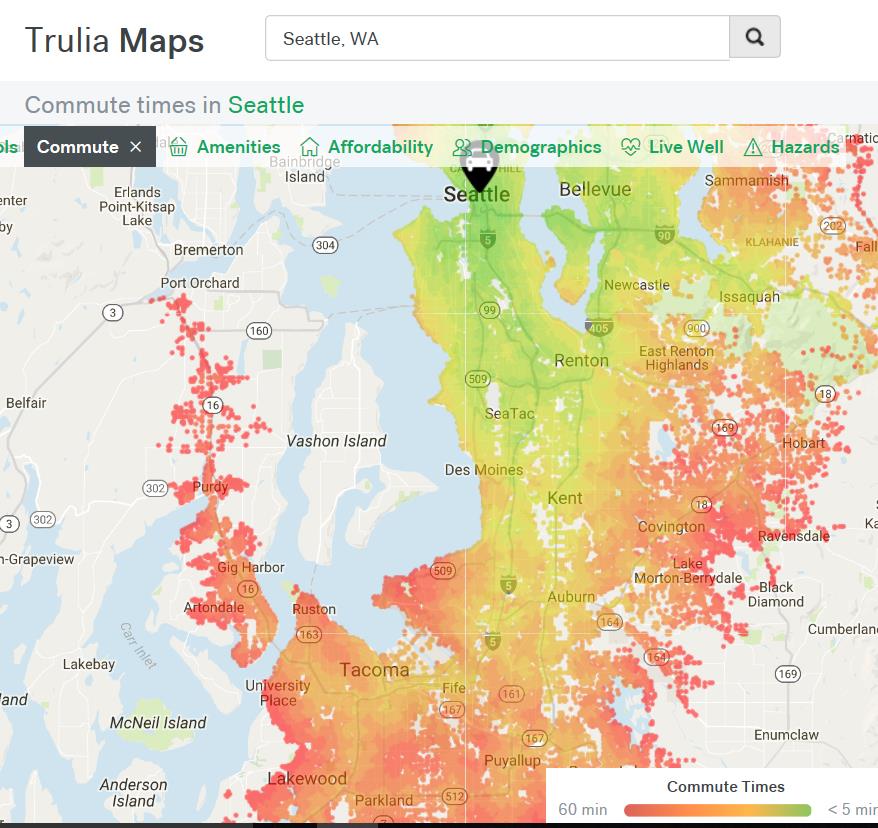
The King County market is red, no….white hot! Why? The King County number of jobs per resident is 207, in Pierce County the number of jobs per resident is 82. The unemployment rate in Seattle is 3.7% while in Pierce County it is 6%. Compare Pierce to U.S. with unemployment rate of 4.7% and see the weak recovery path in the graph below.
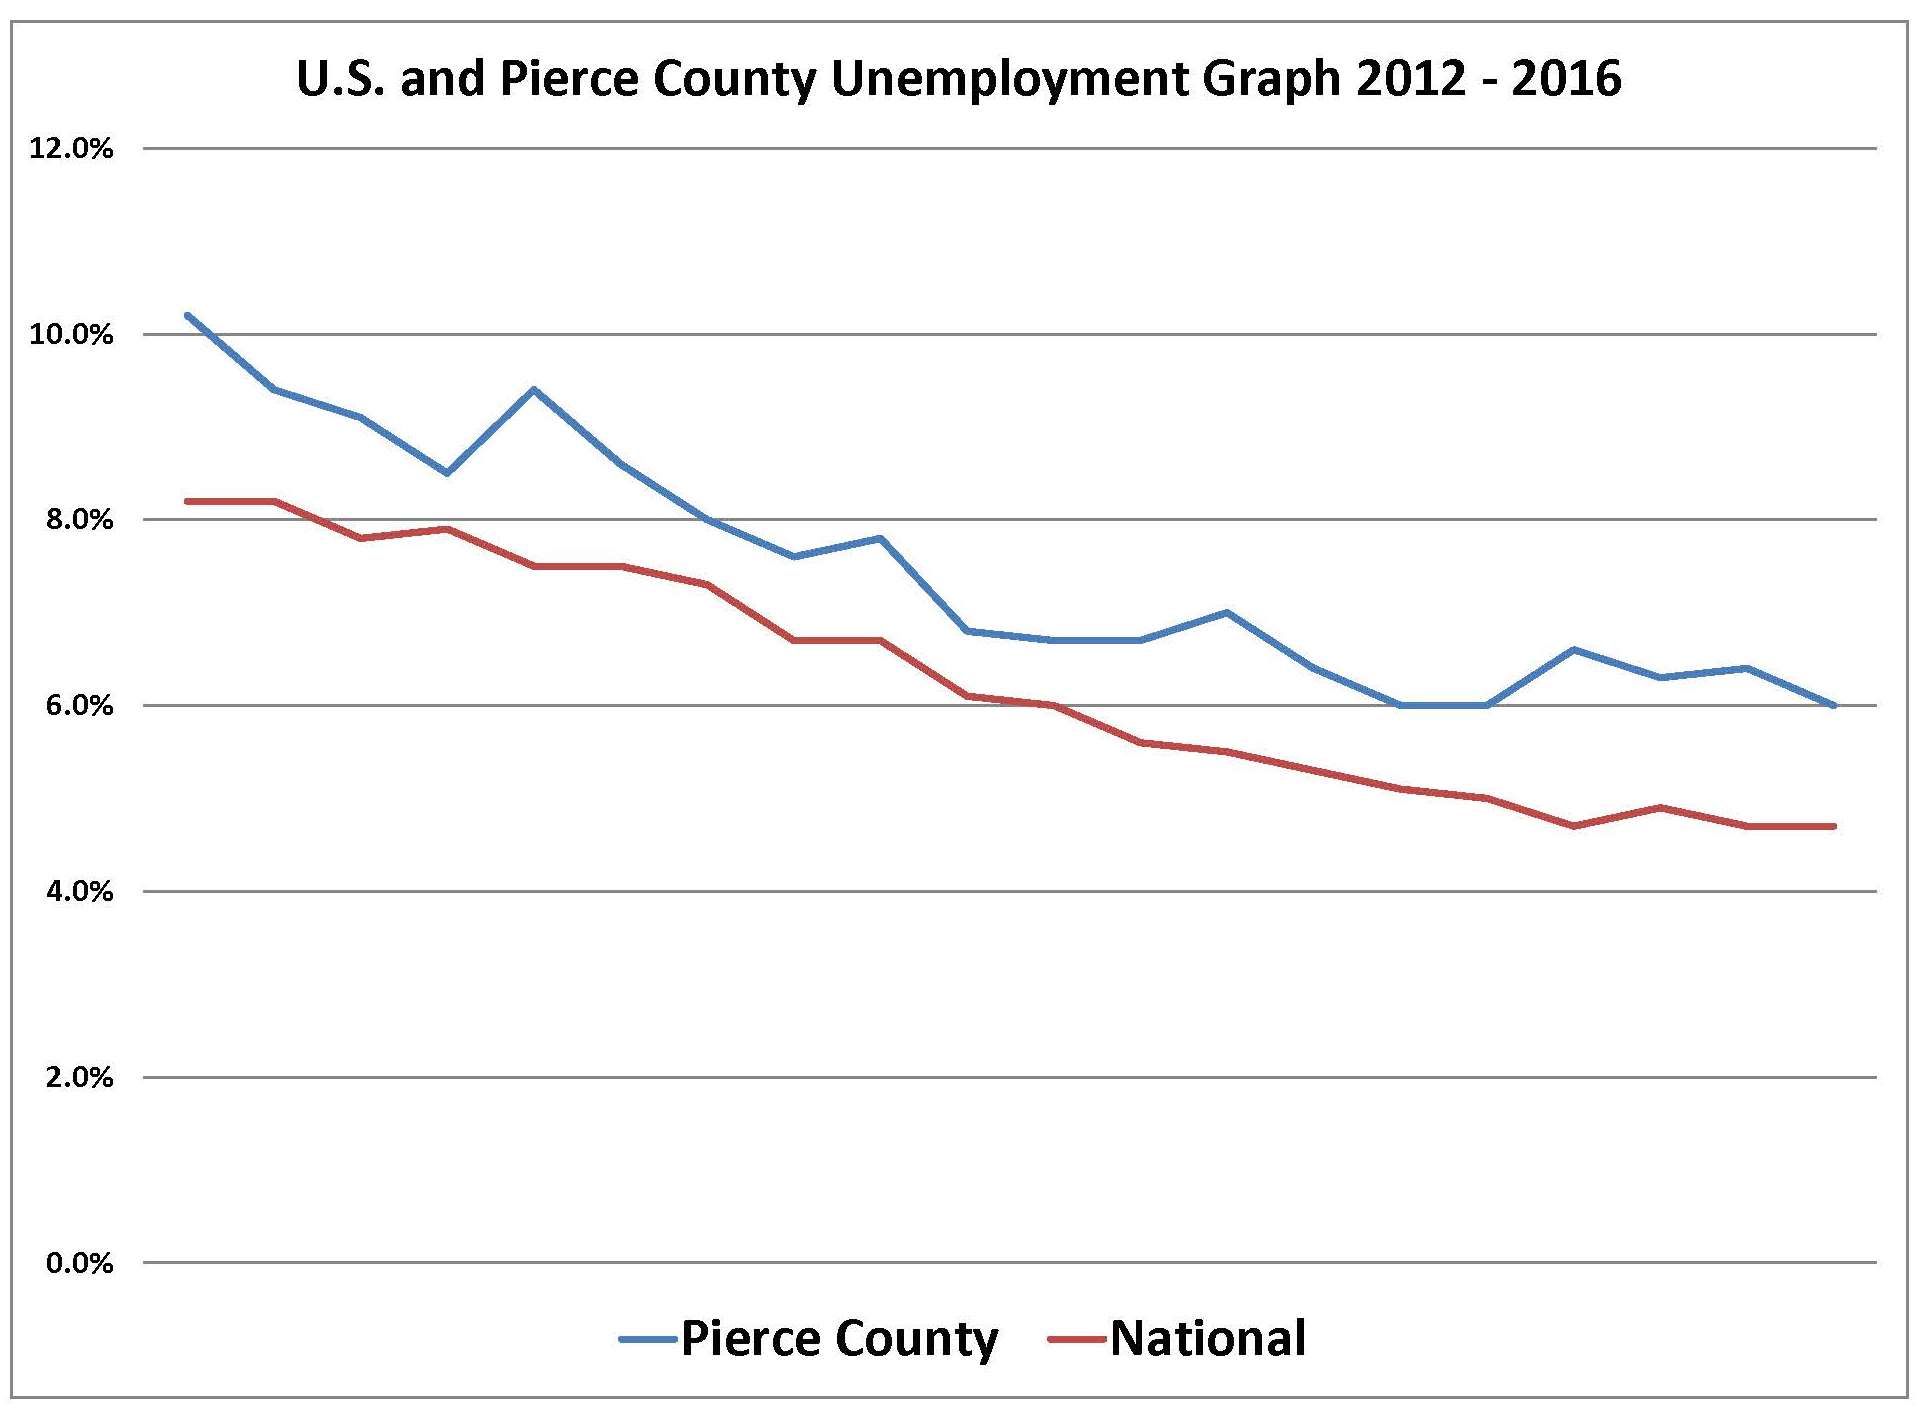
After each of the 3 previous recessions, Pierce County unemployment recovery was better. In the 90’s Pierce recovered to 4.5% unemployment, the pre-recession recovery was in the 5’s, while the current recovery has only reached 6% and it appears to be a post recovery low.
Pierce County’s per capital income is $45,000 and would not be that good were it not for King County jobs. We are fighting a trend of becoming a bedroom community.
Fully 135,000 Pierce County residents have jobs outside the county. Put another way, 40% of the non-military work force don’t work here.
The effect on real estate is the commuter buyer/renter is a big part of our market and will continue to be that way until Pierce County improves it’s workforce skill and attracts new businesses.
With the Pierce County shortage of inventory and the pressure of high prices in King County, homeowners in our area will enjoy another year of increased values, likely in the 9-10% range.
Buyers will need to be fully pre-approved, able to react quickly, and be open to the idea they will likely compete for their dream home.
Yes, it will be a good year for real estate in 2017, but there is work to do if Pierce County wants to be more than just a place for Seattle skilled workers and executives to come home and sleep until they can afford a home closer to their job.
Second Quarter 2016 Pierce County Housing Report
When is a "HOT MARKET" not Hot? and….Are you one of the Pierce County Homeowners poised to "beat the market"?! There is a way to out-perform this crazy market using current trends! More on that below, first the Pierce County headline numbers
Inventory – DOWN – 21.5%
Closings – UP – 5.3%
Median Price – UP – 13.6%
New Pending Contracts – UP – 24.1%
These headline numbers show us the market continues to roll through the summer and buying in this market can be challenging with a high level of increased sales with the backdrop of decreased inventory. What would you say if I told you you could leverage this market in your favor? It's not for everyone but if you're in the market for a larger, or more luxurious home while selling your median priced home, you could be in for a big advantage. Maybe the waterfront or the view you've always dreamed of is within reach!
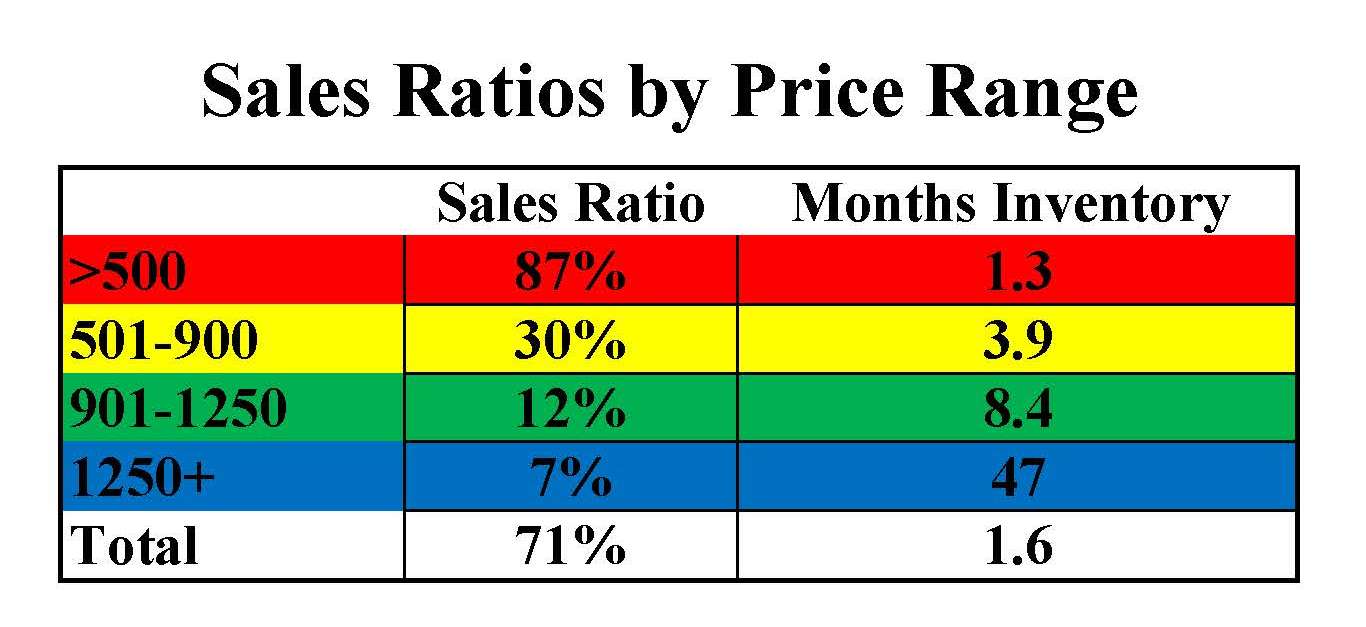
You know I love Sales Ratios as a tool for measuring market effectiveness. Click here for a refresher on Sales Ratios. The Pierce County Market is not performing with the same effectiveness throughout the price spectrum. You can see under $500,000 is HOT! Above $500,000 the market fundamentally falls off pretty drastically.
The way to trick this intense market into working in your favor will begin to be revealed with a look at where the home sales are concentrated. It doesn't take long to see the "high-end" is not performing the same as the median or lower price ranges. I defined the high end in Pierce County as; 2.5 x median price in combined markets of North Tacoma, University Place and Gig Harbor. So, $359,000 x 2.5 = $900,000. Looking at the chart below and the layers of market intensity are quite visible.

By the way, turns out this is nothing new, Pierce County has recorded about 95% of all sales below the $500,000 price level for….well….ever.
The strategic move here says Captain Obvious, "If it is possible with your circumstances to sell in a lower price sector and buy up into a higher one, the negotiation table should be in your favor." If you are selling in a price range where there is only 1.3 months of inventory and a sales ratio of 87%, prices are likely moving up and you can sell at a premium. The farther up the price tree you climb the worse the fundamentals are for sellers and the more things are in favor of buyers.
This market condition is important for high end sellers to realize. It may be "new" news to Pierce County luxury home sellers because there has been so much talk of the "hot" market, but I haven't seen a report break it down by price.
As you can see the overall market averages are impressive and the market is really good! That said, it reminds me of an old saying. "If you have one bare foot in a bucket of hot coals and the other in a bucket of ice, 'on average'…you should be fine!"
Drop me a line if you have any questions or comments, it's always good to hear from you!
Pierce County Housing Report Supply vs. Demand
Last week I talked about the shortage of houses for sale in Pierce County being notably below the demand and how this condition makes the home buying and selling experience a little testy for many. Buyers have to make decisions quicker than they might otherwise like to, sellers face tricky waters getting their price right, and the negotiation process can have some tension that both may prefer to be without.
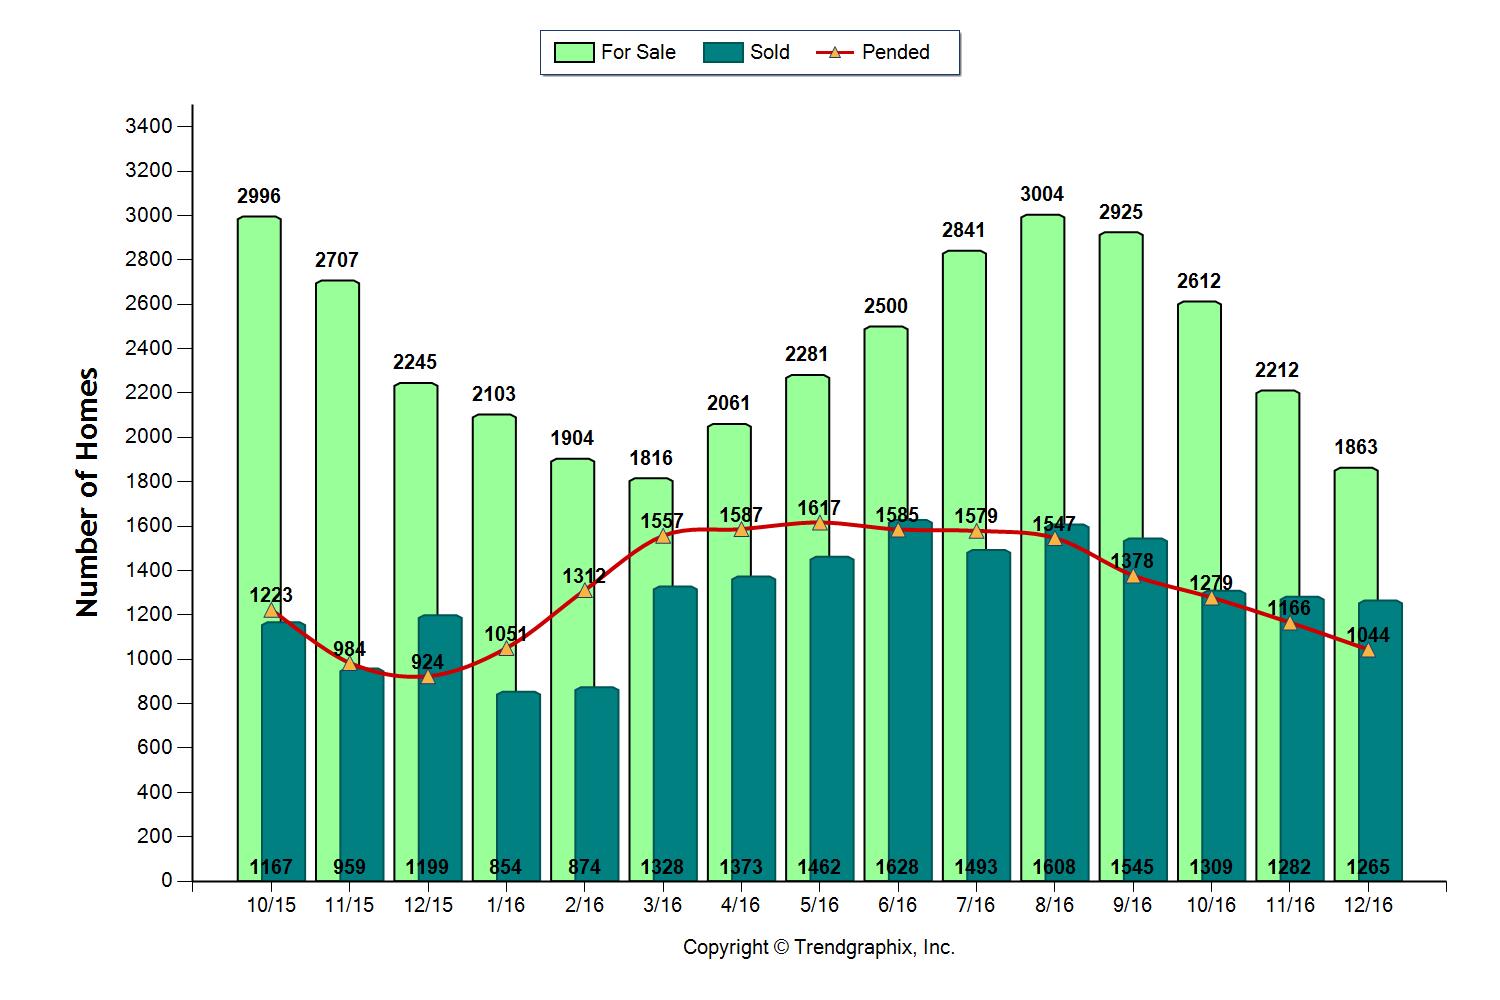
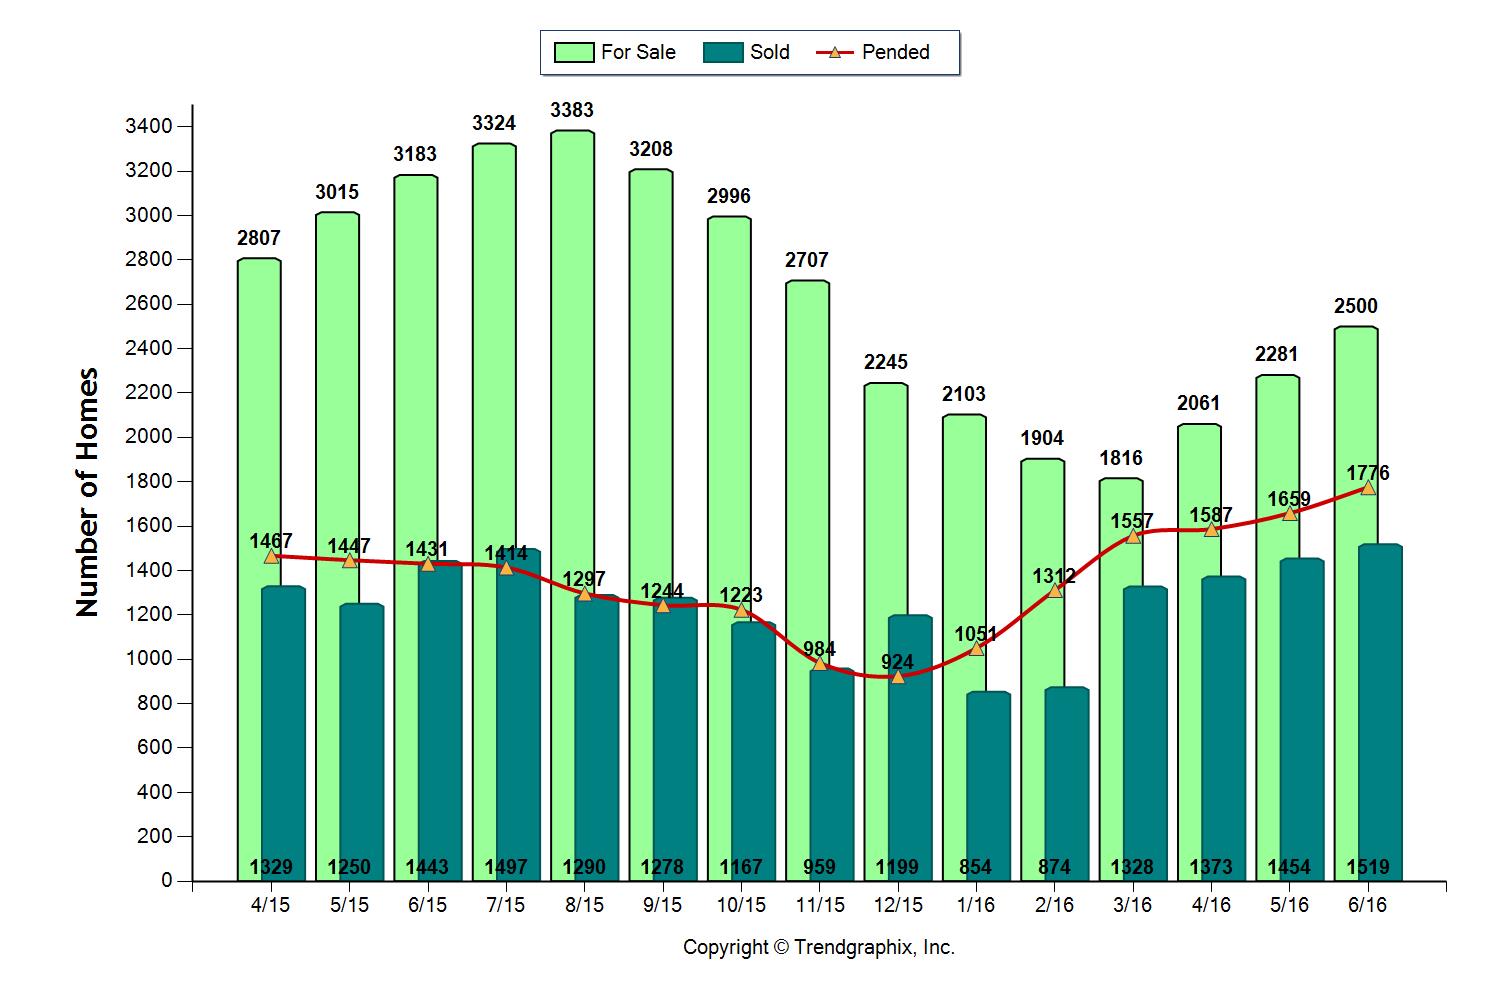
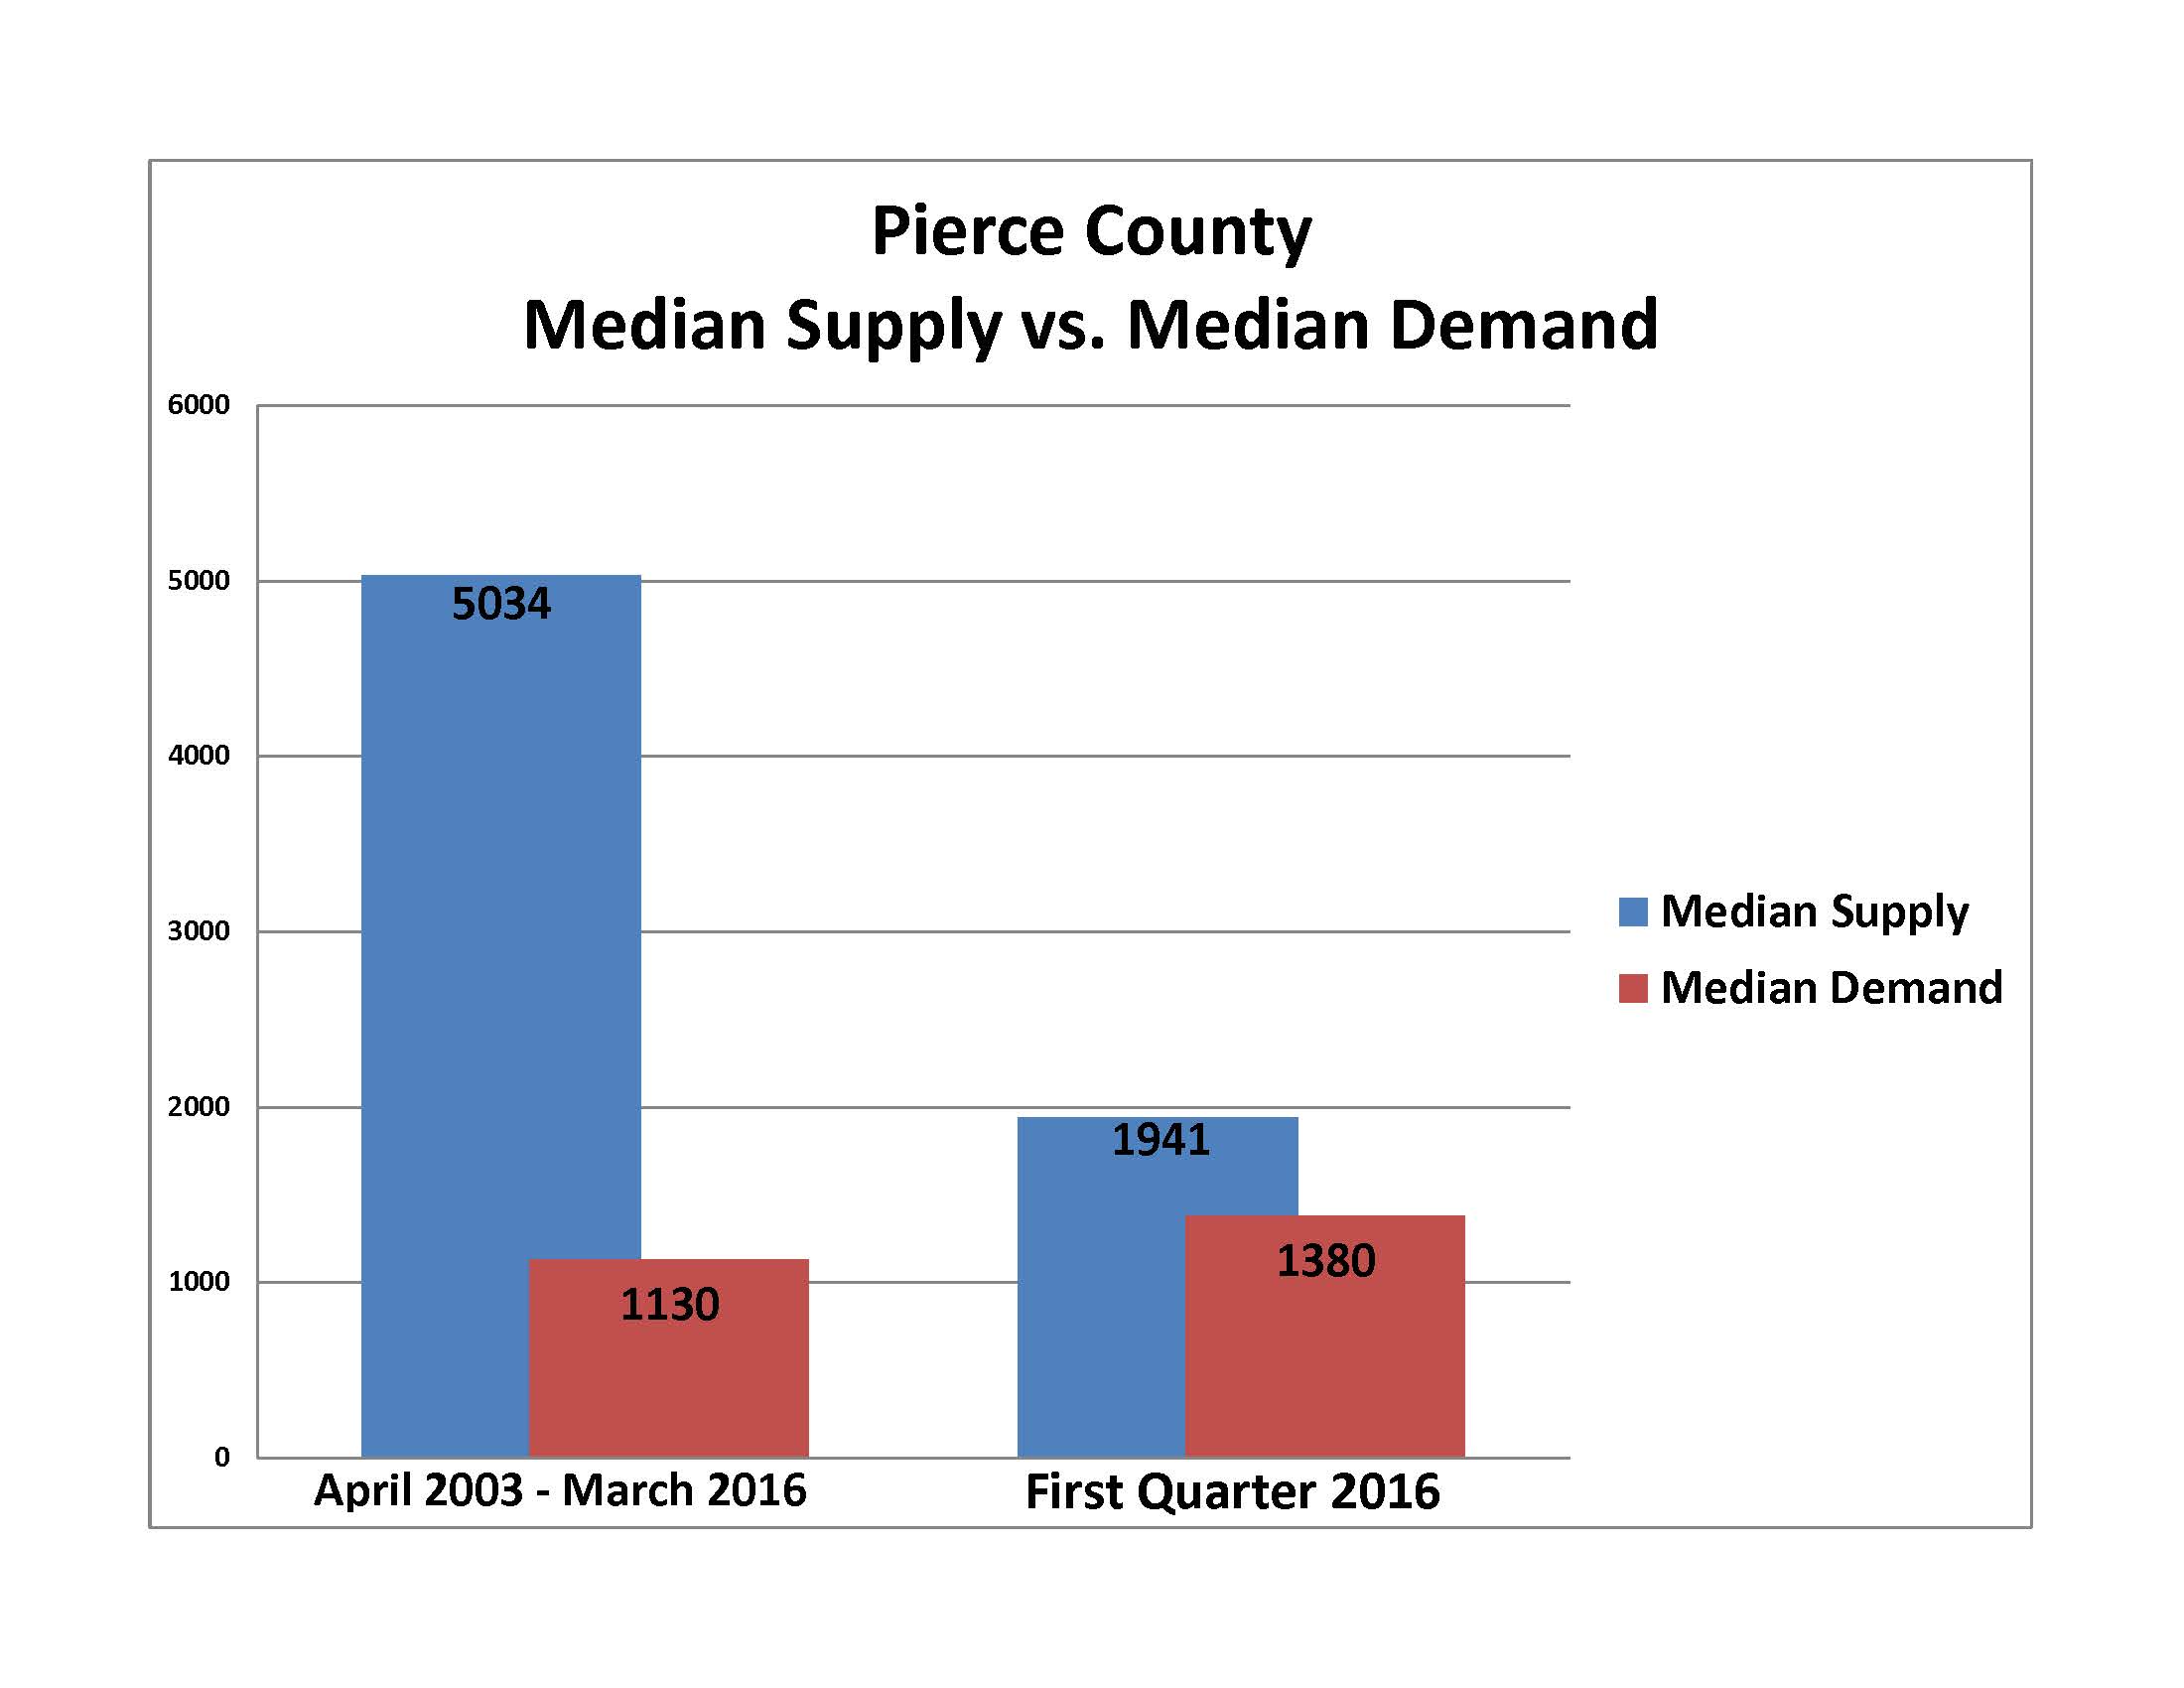
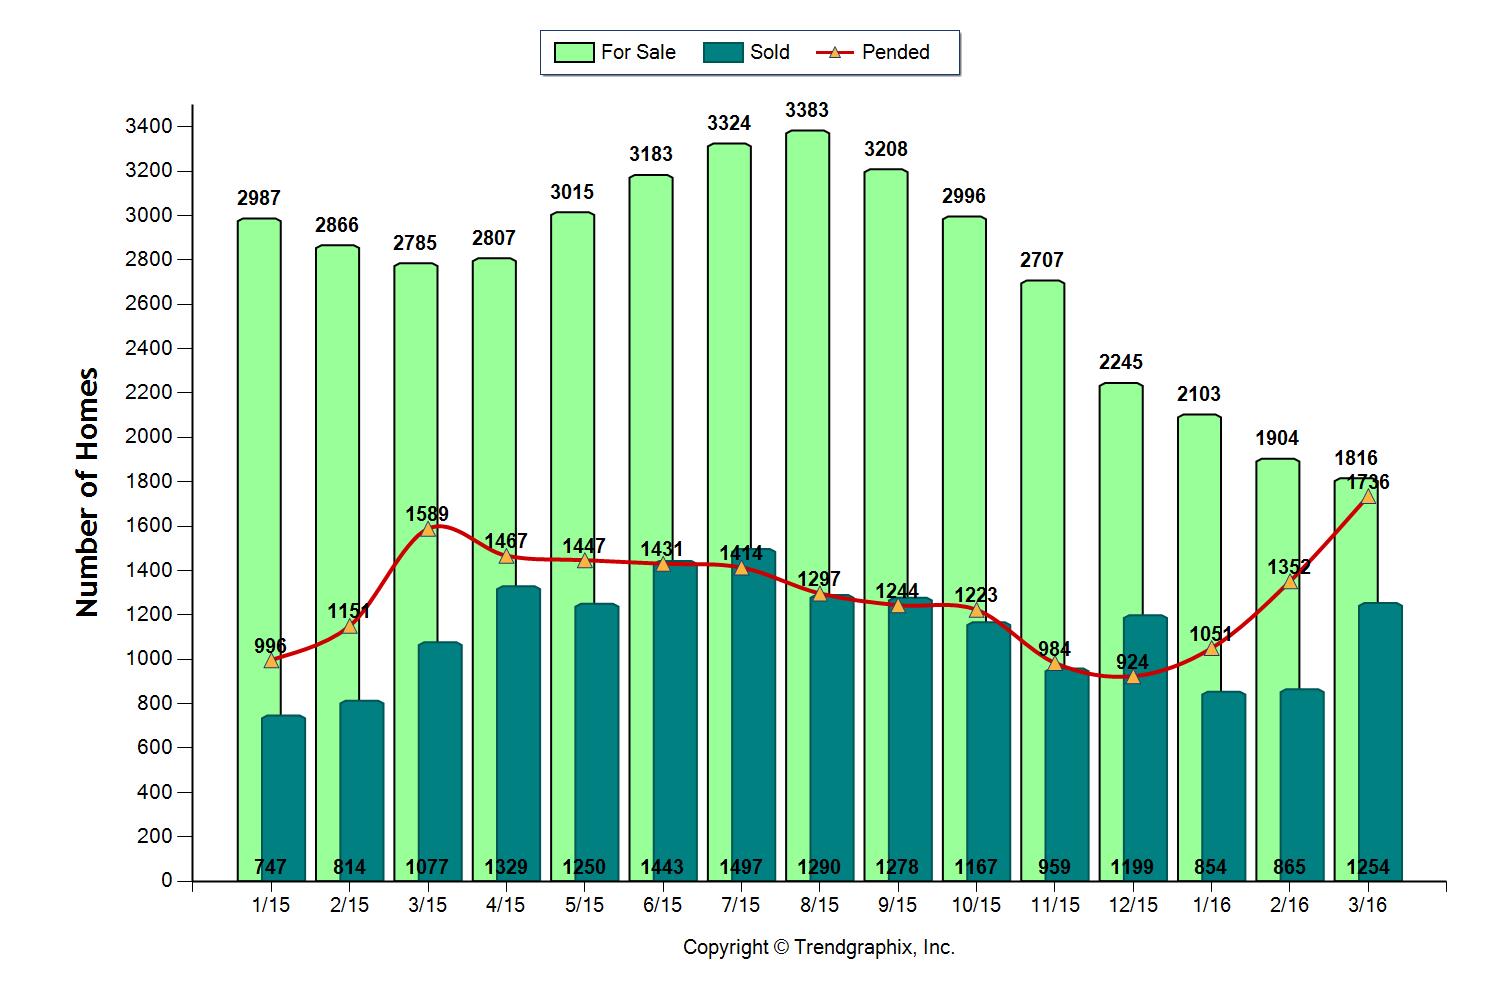
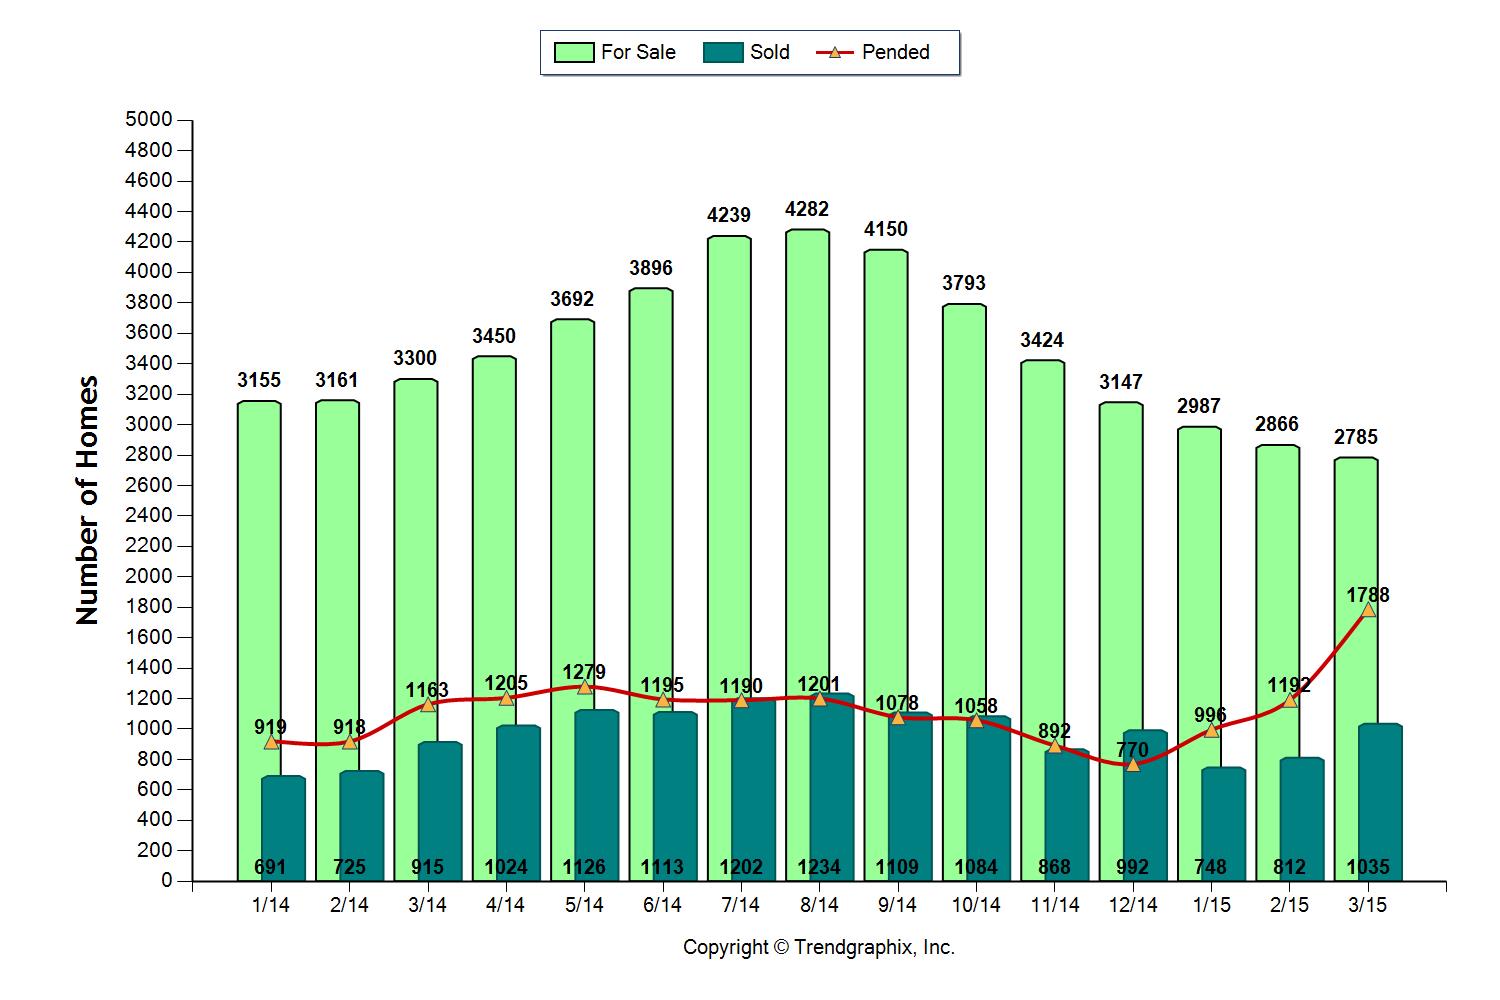
In the process of preparing that report I began to wonder; “Is demand really high or supply just super low?” I referenced some historical Pierce County housing data for perspective. The chart below represents 14 years of Pierce County housing activity. The bright green bars represent supply of homes; the dark green bars represent closings while the red line tracks Pending sales.
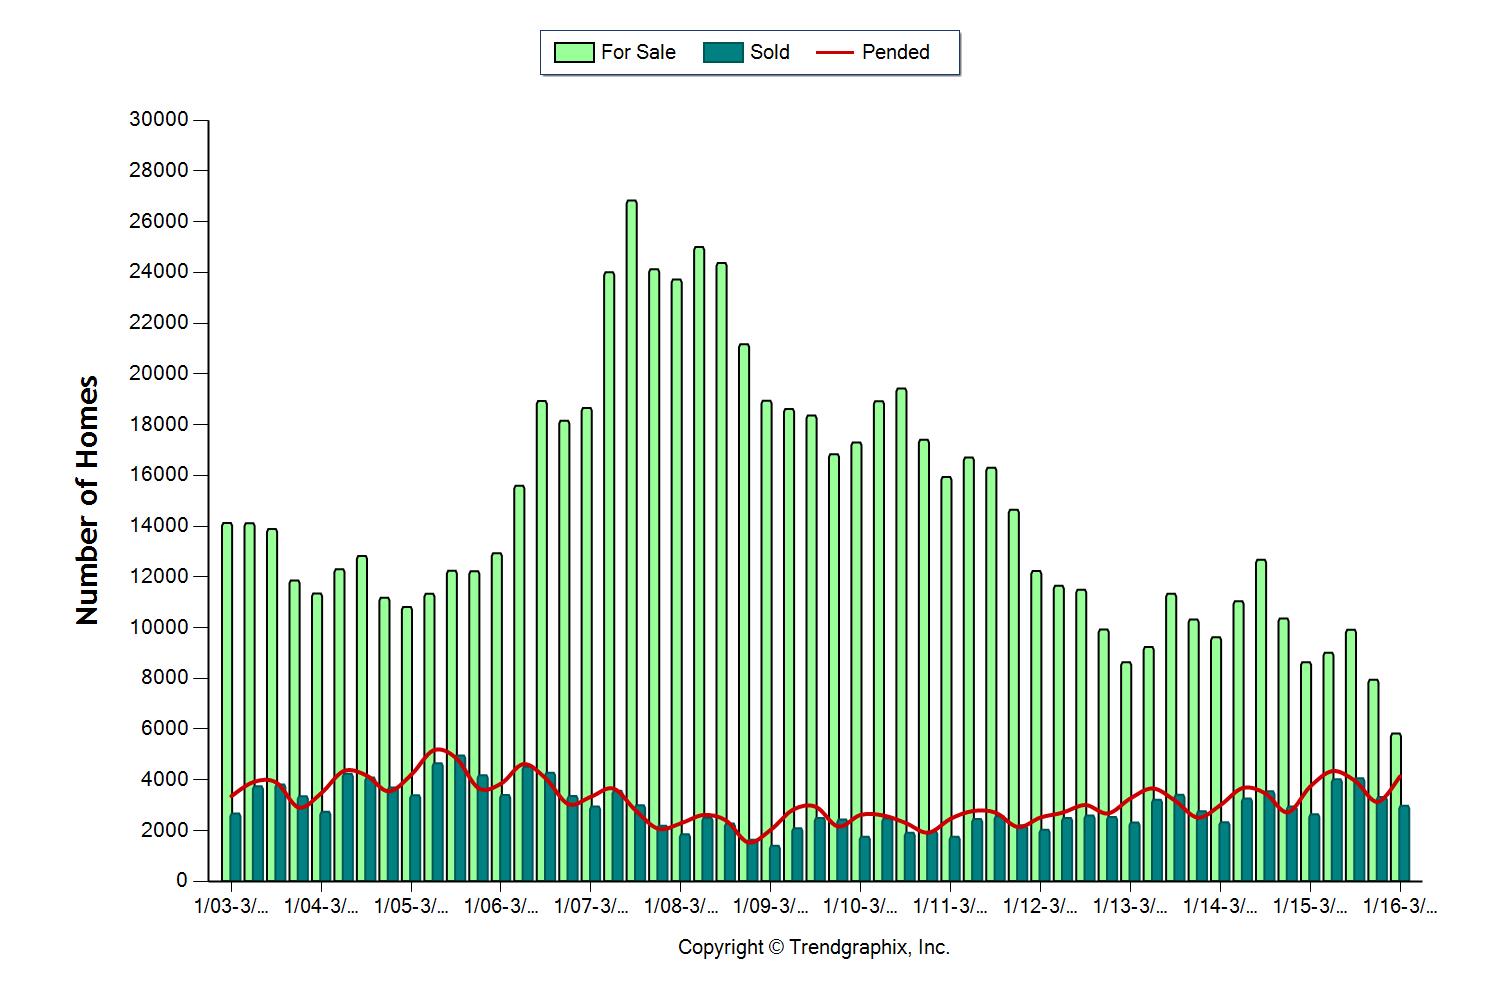
As soon as I prepared this graph the Pending line caught my attention, I call it the “Demand” line, and it is shown in red on this graph. When stepping back 14 years we can see there is certainly some fluctuation in the “Demand” line, but it looks relatively flat compared to the “Supply” line! Getting a little geeky I set out to measure the two, here’s what I learned after sifting through 14 years of data.
Next I wondered how often the demand or supply fluctuated higher or lower than 25% of the median. I wanted to know what, if anything is out of whack with our market “today”.
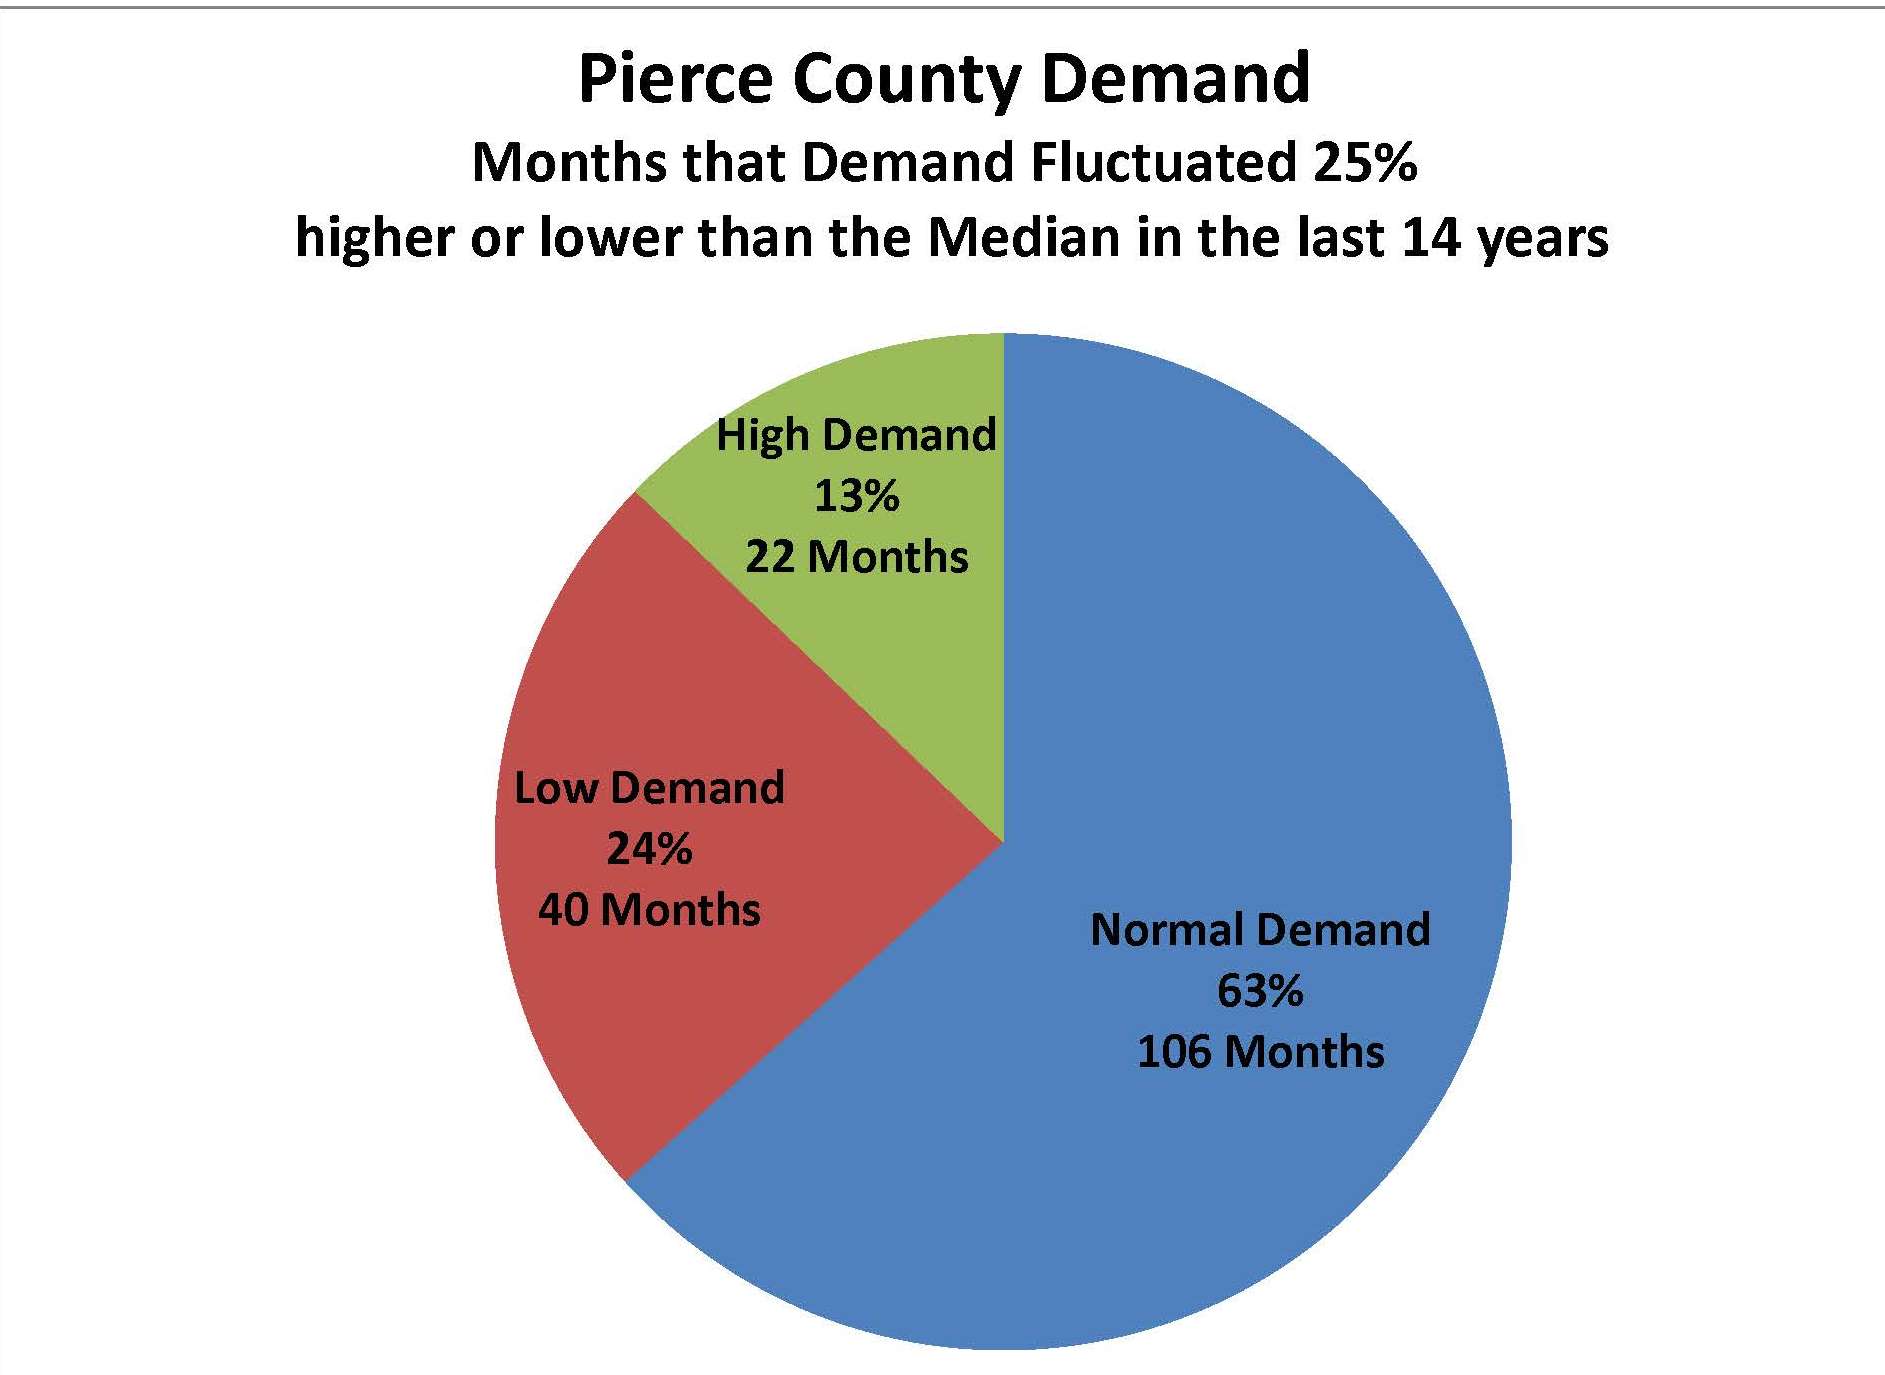
As you can see, in the last 14 years 63% of the time demand is within 25% of the median, and surprisingly has only been more than 25% above the median 22 out of 168 months (13%). Currently, demand for Pierce County housing as measured by 1st Quarter 2016 is in the high side of the “Normal” range. At 1,380 Pending sales it is 22% above our 14 year median. Not the same story for supply.
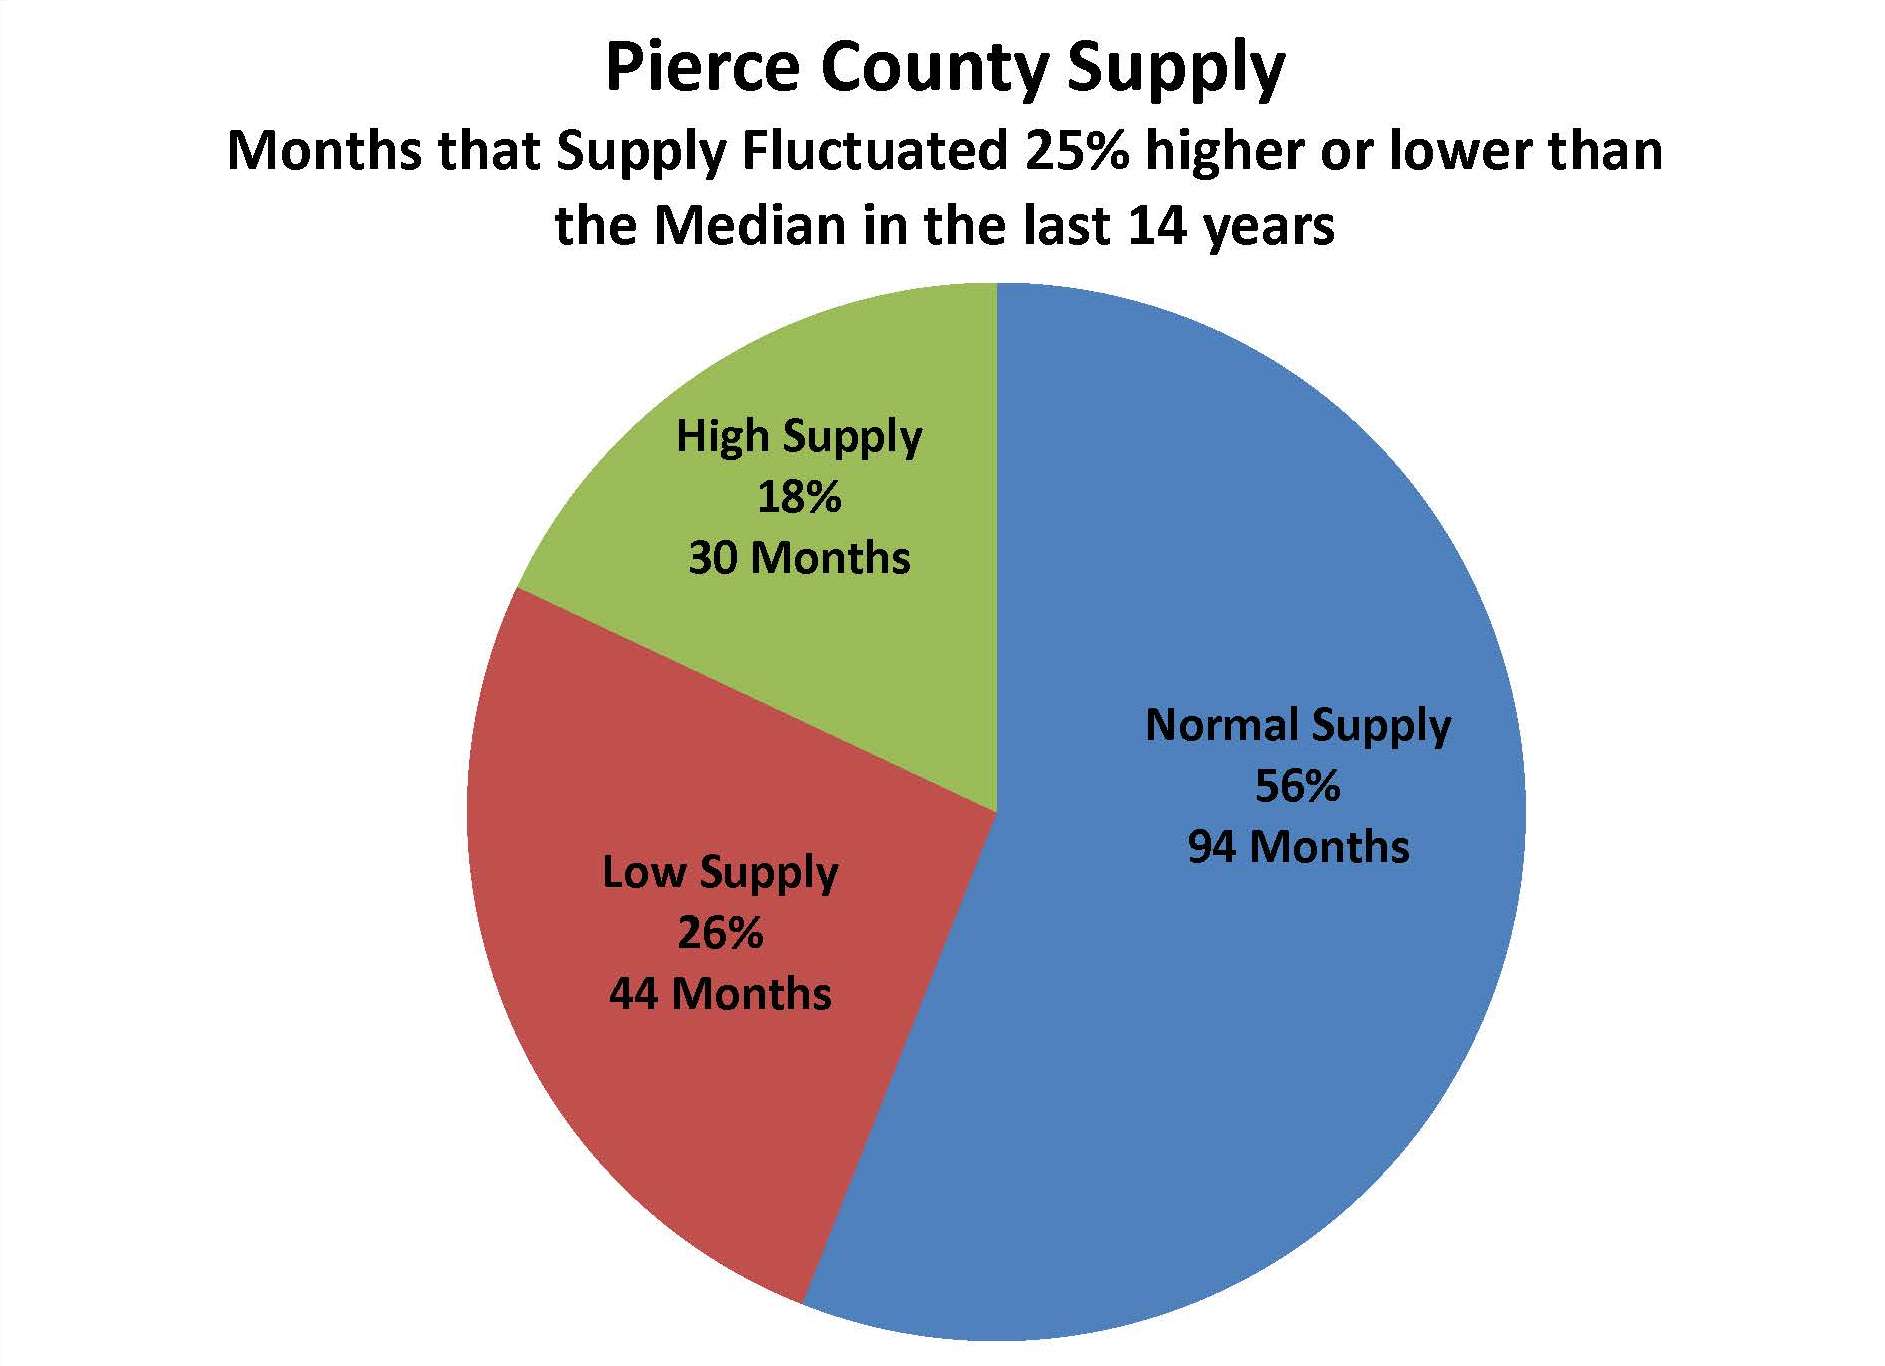
Our 1st Quarter supply average is 1,941 which is 61% below the median. Insert shocked face – here! – Pierce County is low on inventory! What is extraordinary about right now is the inventory has actually been in this “more than 25% below median” status for 29 of the last 36 months. Additionally, while I earlier stated that the 1st Quarter average demand is within the “norm”, if we only look at March demand it is 54% above the median making it one of the highest demand months in 14 years.
So what are we saying here?
Even though the market feels like there’s an extraordinary amount of pressure it’s been like this 80% of the last 3 years. March has us feeling market tensions in an exaggerated way due to a spike in demand along with the chronic low supply of homes we have been living with. It is also important to remember that the conditions described here are going to vary (sometimes a lot!) depending on where and what price range in Pierce County you are looking. This is one more reason why it is so important to have a Realtor at your side that can show you the #’s for your area. There are opportunities to sell into a High Demand/Low Supply sector and buy into a Normal Demand/Normal Supply sector. More on that next time!
First Quarter 2016 Pierce County Housing Report
You don't need me to tell you the market is great! The market is really back! Media is buzzing with positive housing news complete with rising prices, inventory shortages & bidding wars coupled with low interest rates and a strong economy! What's not to like? It is great, but like so many things there's two sides to the coin and the answer is, "it depends!" First, a look at the numbers for Pierce County as measured on March 31st.
Inventory – DOWN – 35%
Closings – UP – 16%
Median Price – UP – 9%
New Pending Contracts – UP – 28%
These year over year numbers are astounding. We have over 1/3 fewer homes offered for sale while at the same time we have an increase in the number of closings by nearly 1/3 creating a classic demand exceeding supply scenario. Pierce County houses are selling in an average of 59 days, the shortest length of time measured since July 2006.
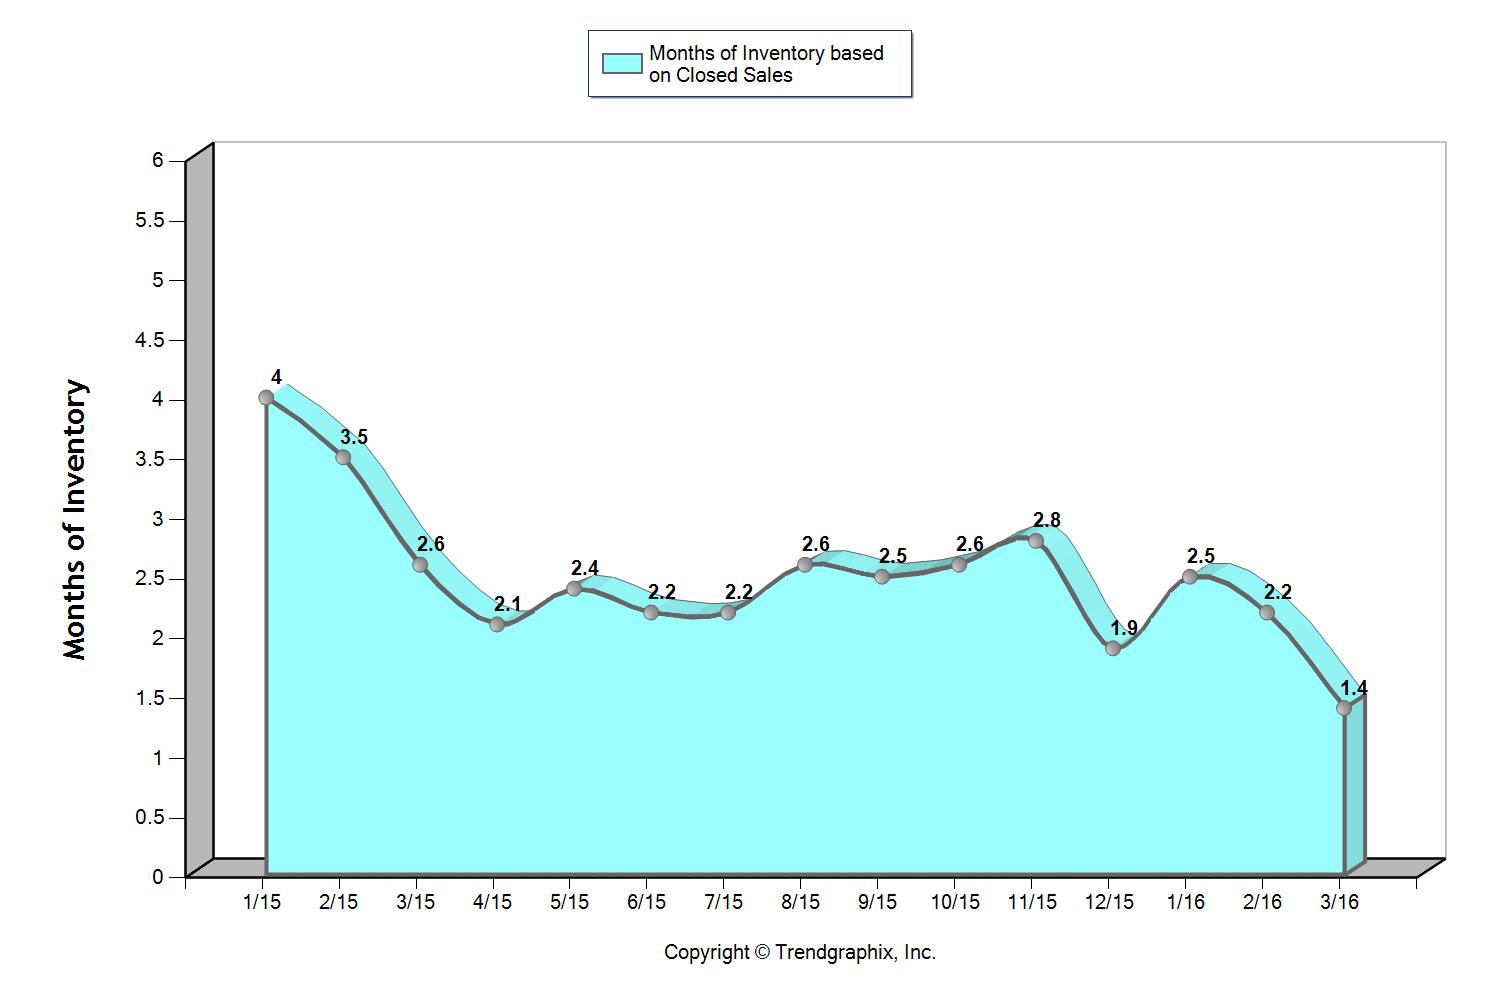
In the past I've referred to sales ratios as being one of the most accurate way of describing the strength of the market. (To read a past description of Sales Ratios click here.) We know a balanced market has a sales ratio of 55%, currently the numbers give Pierce County a 95% sales ratio. We have nearly as many houses Pending as we do Active. Yikes! Another key measurement of a housing market is Months of Inventory. The target here for a normal "breathe through your nose" market is 3-5 months….Survey Says!! 1.4 !!
Most would say, "This is a great time to be a seller and a challenging time to be a buyer". There is some truth to that, but in reality, it can be a challenging time to be on either side of the table. Sellers naturally want to price their home accordingly to take advantage of the favorable market conditions and not leave any money on the table but proper pricing strategies right now can be elusive. Meantime, no buyer wants to "get in a bidding war" and the result is a tension from both sides that can get interesting. Consider this scenario that recently played out;
Our new listing just hit market – Within days we have two offers! No, wait three! Buyers are notified, "we have multiple offers!" First one raises offer – second stays put – third one goes dark! Aghh! Then, just before time to review and sign off, first one lowers to original amount…..oooookkkkayy! So second one goes away to chase another house. Wait!, first one has gone dark now too! What the..?! day goes by….first one is out! Good grief! Word is #2 didn't get the other house they were chasing….so go get #2, right?! Ohhhhh we can't! #2 has now decided house is too close to a relative she doesn't want to be so close to!
Day 15 – still on the market.

With the added tension of this fast paced market sometimes decisions have to be made quicker than we would like and the resulting flip flopping can be hard on everyone!
Despite the obvious inventory shortages and low market times it is not hard to find homes that have been on the market for 100 days or more. That shows us the market is not all forgiving and throwing any high price on a property will fail. For sellers it is a delicate balance between pushing the envelope and being realistic. For buyers, the last house is not the last house. Find good counsel in a trusted Realtor, have a pre-approved loan in your pocket, and the right house will come to you at the right time.
Markets seek balance and the current shortage of good homes will not last forever, it never does. Yes, prices are going up, and that erodes buying power. In the process new neighborhoods evolve as qualified buyers gentrify more affordable areas. The dream of having the right home to call your own is still obtainable.
First Quarter 2015 Pierce County Housing Report
We appear to be in for a wild ride in 2015 when it comes to the Pierce County Housing Market! So how do you navigate it if you are a seller?! What are the best strategies for a Buyer to get the home they really want? I'll discuss that and more in this article but as always let's start with the Pierce County numbers as of March 31st.
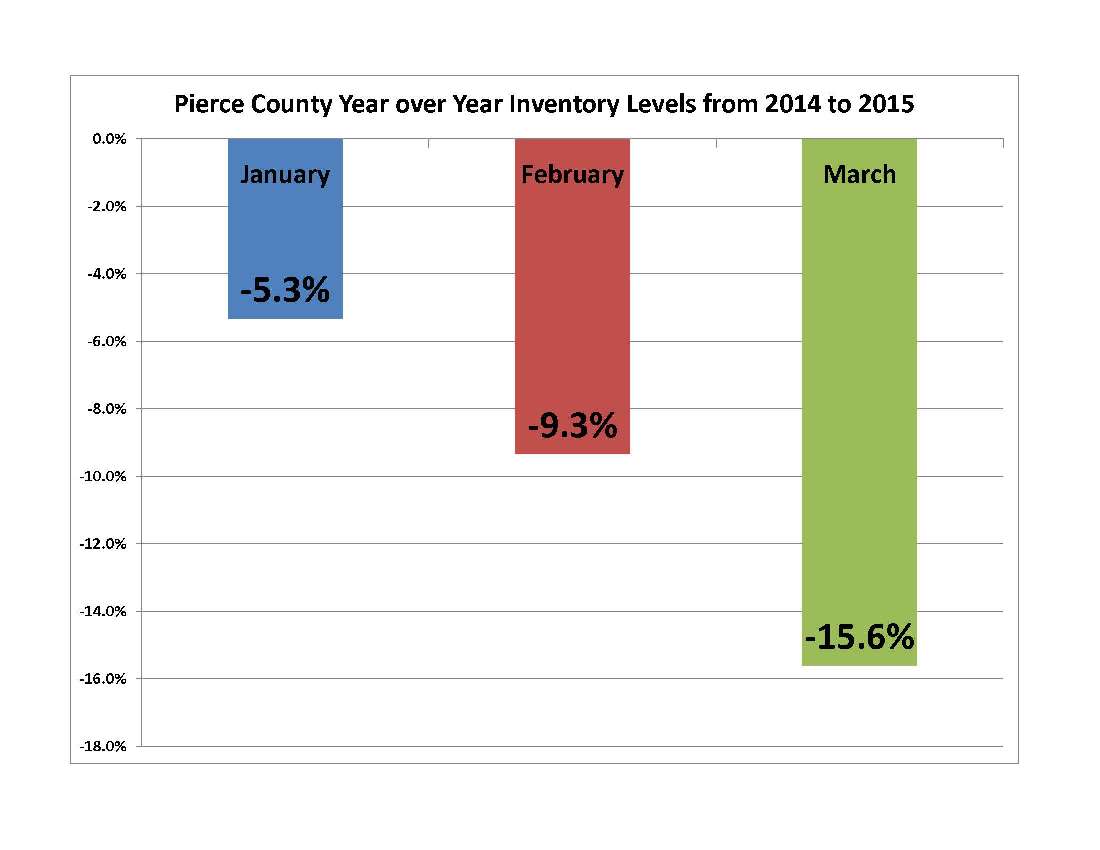
Inventory – DOWN – 15.6%
Closings – UP – 13.1%
Median Price – UP – 8%
New Pending Contracts – UP – 53.7%
These Year over Year numbers tell us the market is hot, in fact the Months of Inventory (MOI) is at 2.7 based on last month's closed sales. This is the lowest since Q3 of 2005. Anytime the month's worth of inventory dips below 3 months we have a market environment that favors sellers and encourages price appreciation. Also, year over year inventory levels have been declining steadily in Pierce County so far this year.
The primary reason for these dramatic declines comes as no surprise…Pierce County home buyers have been busy! There may not have been much snow in the NW mountains this year but our Pending home sales chart looks like a ski jump with Pending sales up 33% for Q1! Inventory is the biggest key to how our market plays out for the balance of 2015.
So inventory is down and sales volume is rocketing. "If I want to sell my house I can ask whatever I want and buyers will flock to my door…right?!?" Not so fast! The answer is…."It depends". Turns out, like so many things in the world of statistical sound bites, there are some distinct differences in the experience you can expect as a buyer or seller depending on what price range you are in. Bear with me as I set this up.
There are 2 data points when evaluating a market that are, IMHO, the most valuable predictors of what to expect as a buyer or a seller. One is the Sales Ratio; I explained the Sales Ratio in a blog last year, if you want to refresh you can link to it here . In a nutshell 55% is a balanced market, the higher the sales ratio number, the hotter the market, and the more likely things are in favor of the seller. The second number is Months of Inventory (MOI), with this indicator the lower the number, the more likely is that sellers are in control. Low MOI says at the current sales pace the market will "run out" of inventory if new properties don't come available or demand slows down.
Overall PC has a sales ratio of 64% and MOI of 2.7. Both numbers tip in favor of sellers. Combined with the trends discussed in my opening remarks you'd think it's time for prices to move higher across the board. If you are working with homes under $500,000 you'd be absolutely right..you may even be accused of understating the situation, but if the home is over $500,000 it may require a closer examination. Take a look at the following;
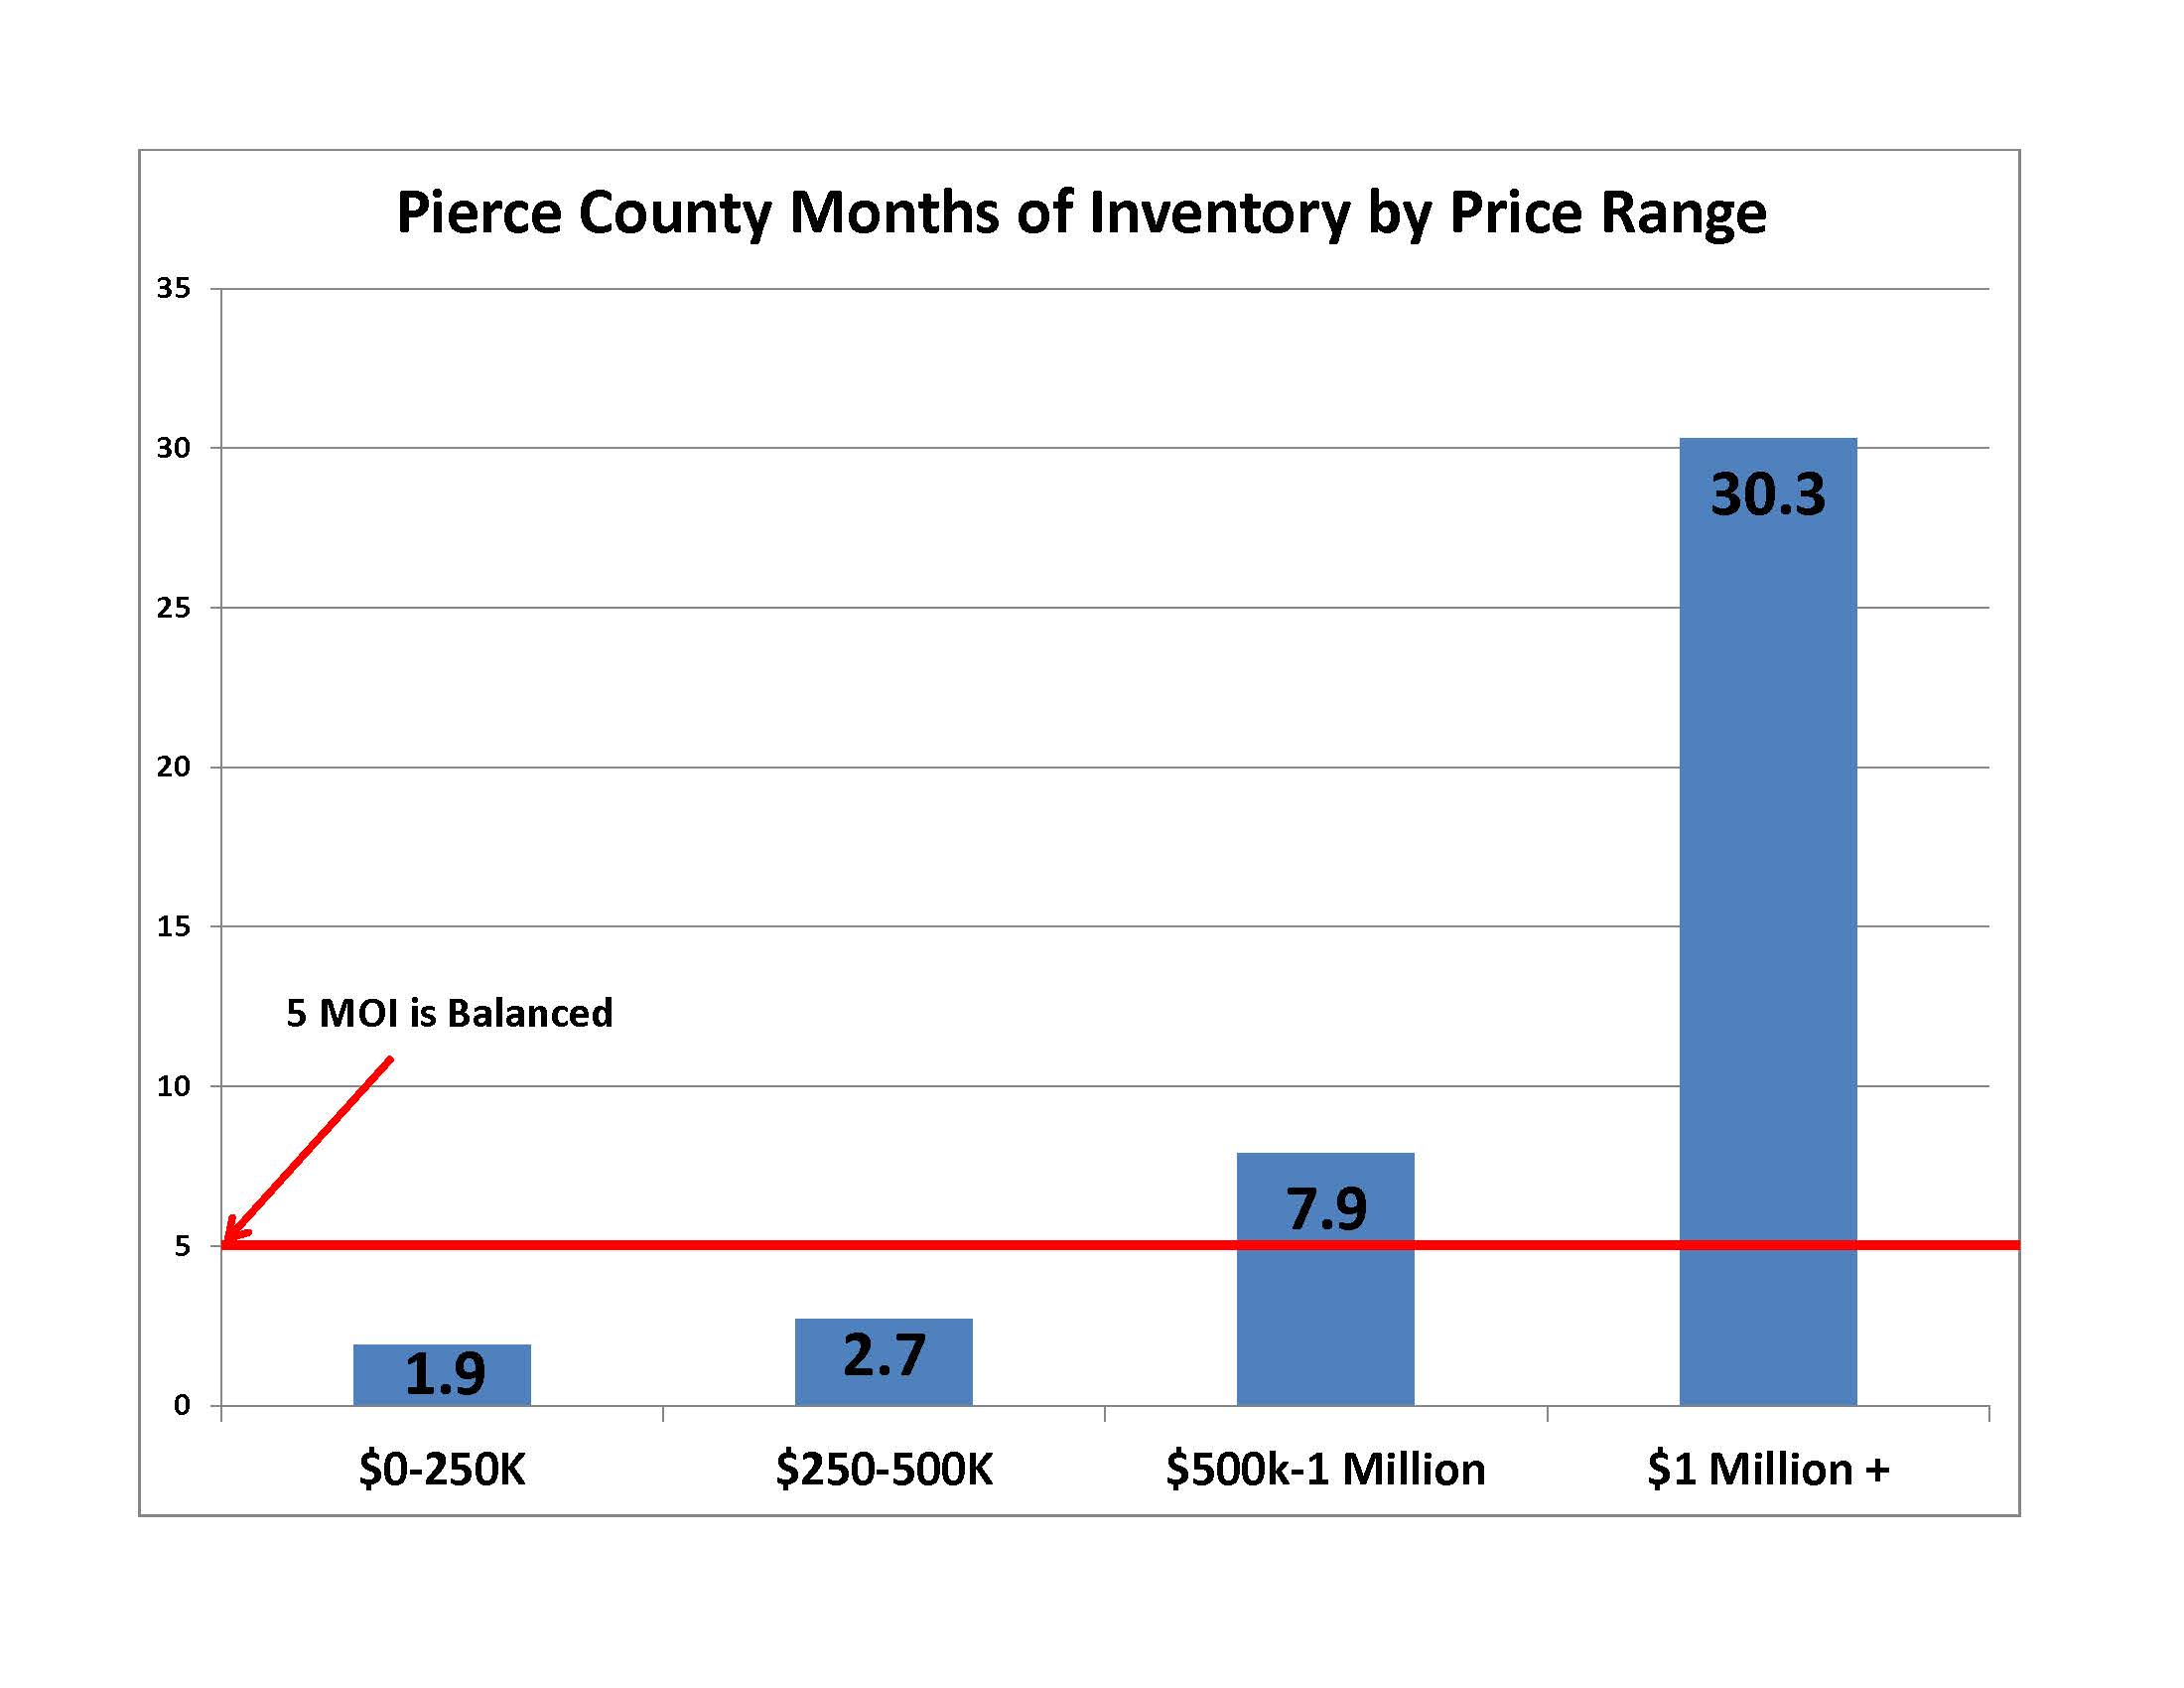

Millennial buyers, first time buyers, investors, and more are super heating the market under $250,000. I would argue that a 90% sales ratio is not even sustainable, prices have to increase to temper the demand and allow the inventory level of only 1.9 months supply to eventually come back in line. A buyer in this price range needs to choose a broker well networked and steeped in local knowledge. One that is plugged into technology that receives quick market alerts and is accessible; able to move quickly for you when good properties come available. In this price range the broker needs to be able to advise you on how to groom your offer for greater likelihood of acceptance without giving away important rights you need as a buyer and ensuring your transaction is financially safe.
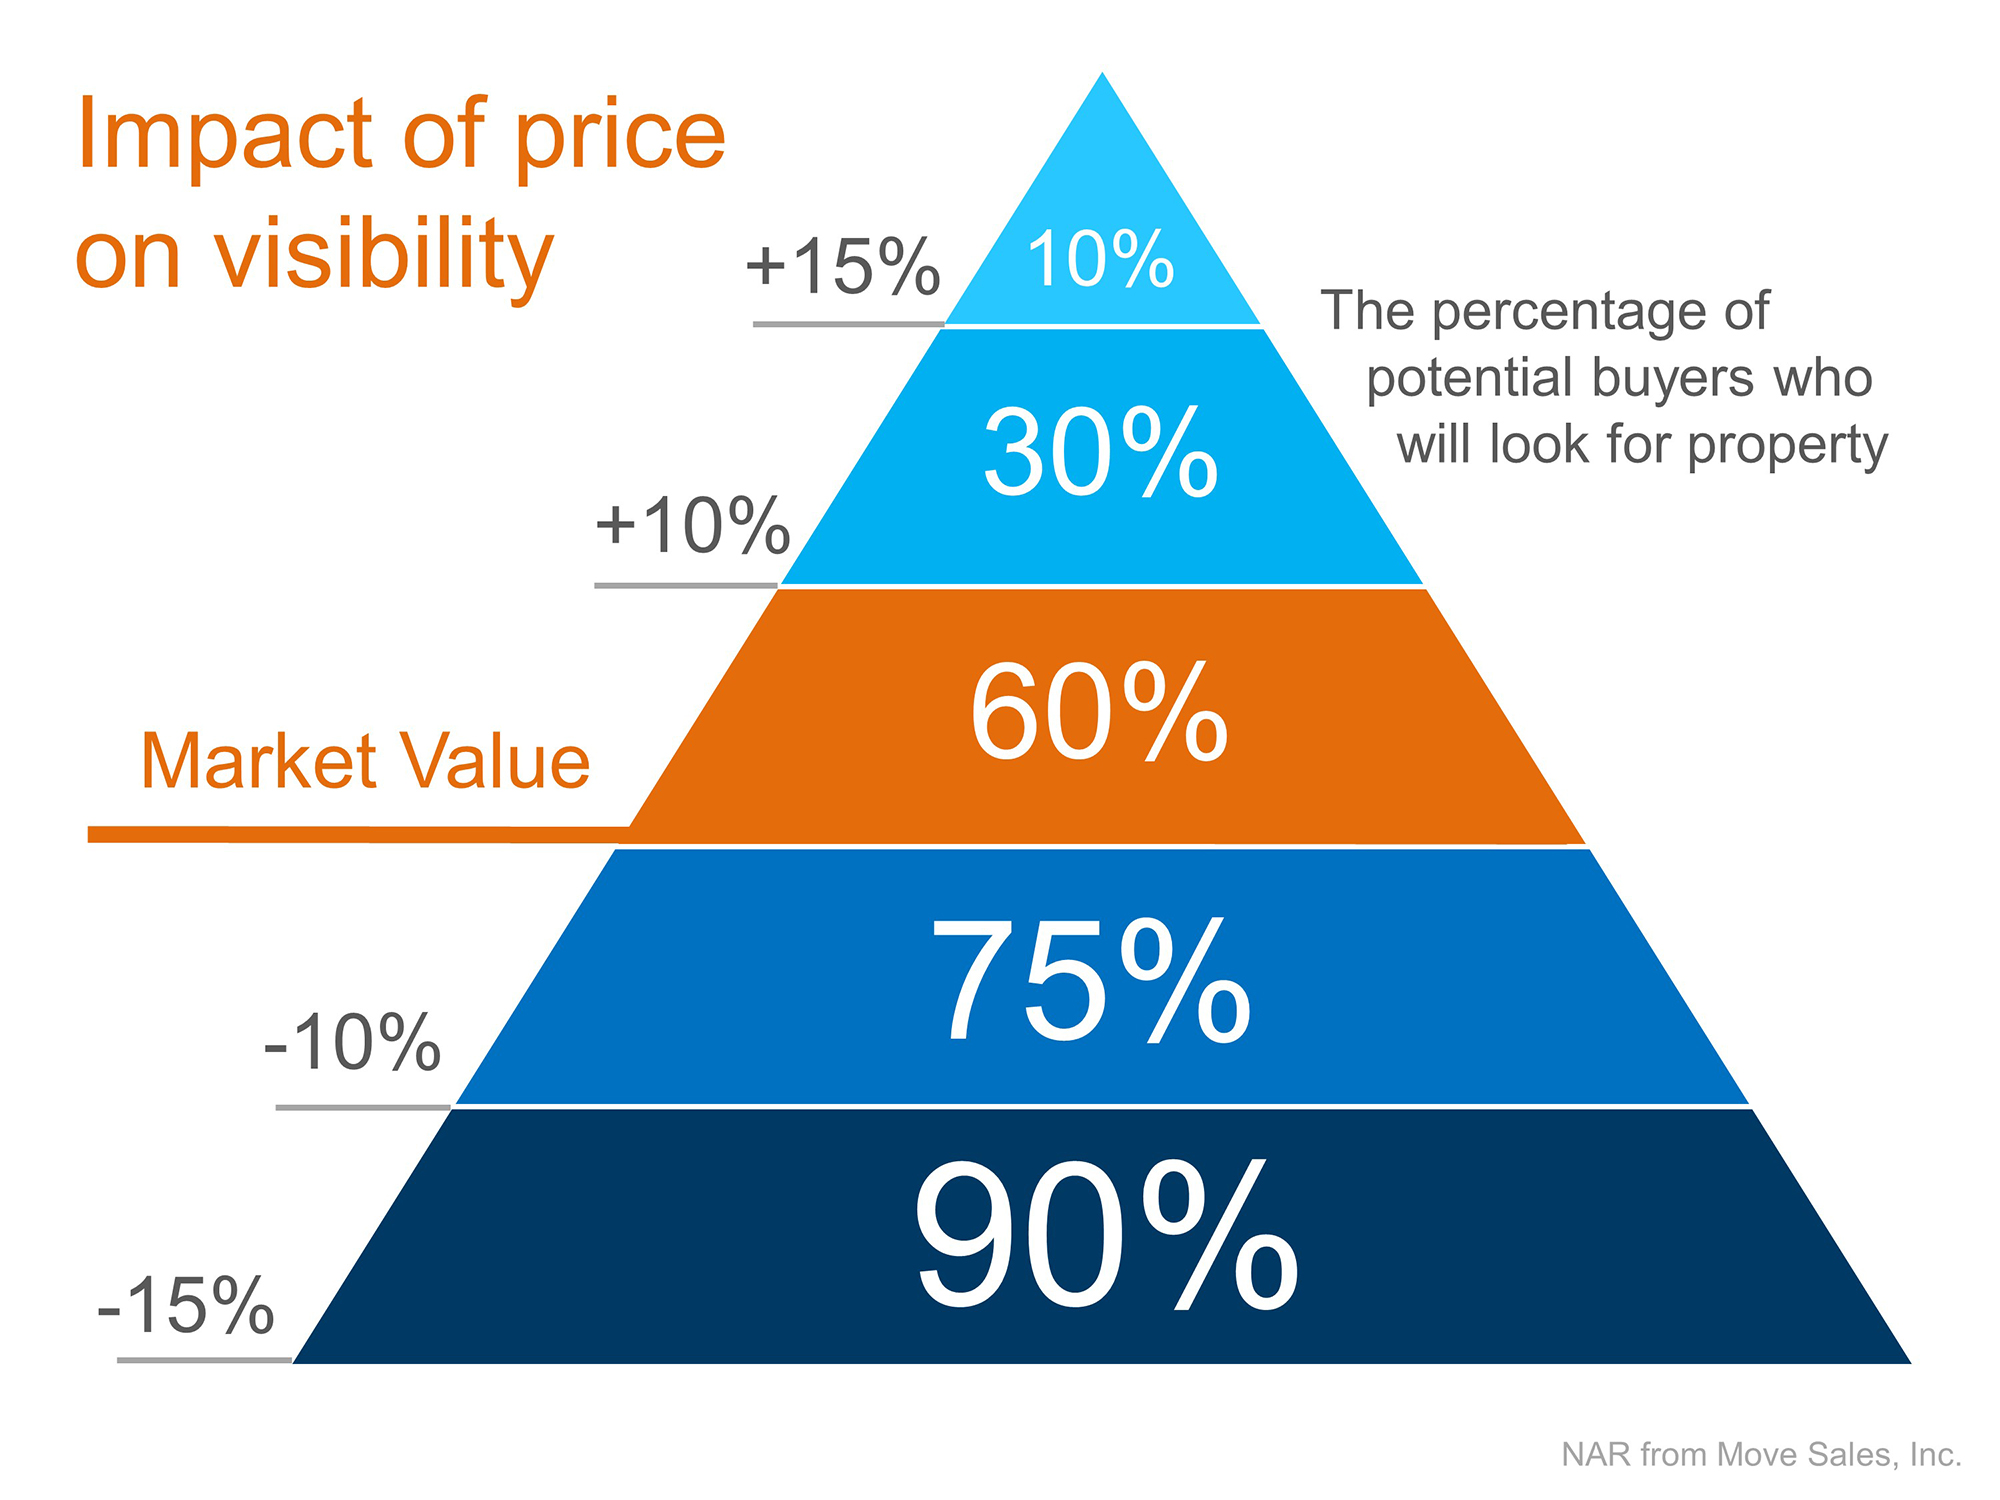
Conversely, between $500,000 and $1,000,000 a 21% Sales Ratio and almost 8 months of inventory is not a market condition that pushs prices up. Sellers here need to carefully evaluate their pricing strategy based on sound data that their broker can provide. If the Pierce County home is in the higher end, they are likely entering a market crowded with competition and it is worth considering the Impact of Price Visibility as shown on this chart;
The other take away I see in these numbers is the fact that if you're worried about finding your new dream home after selling the one you're in now, it may not be a concern if you are moving up into a larger or more deluxe dwelling.
In this ever dynamic market, sound professional advice and guidance is key to your real estate success. One newspaper or newscast headline does not fit all, and without local expertise with real time data it is easy to mis-step in such a fast paced real estate market.
U.S. Foreclosure Filings Down 18% from 2013 level
In 2014 the U.S. foreclosure filings dropped to 1 out of 118 housing units. This is the lowest it has been since 2006. Read more here. Curious how this affects Pierce County Housing? Call or email me to find out!
Post Summer 2014 Pierce County Housing Report
Evidence of Slowing Appreciation and Reversion to Normalcy.
Also, how King County's trending may soon affect our local market.
Markets Continually Seek Balance The Pierce County Housing market as measured by August 2014 numbers gives us a clear indication it is efficiently balancing and allowing home buyers and sellers to participate with predictable results.
Inventory – UP +11%
Closings – Down -02%
Pending Sales – UP +21%
Months of Inventory – UP last year +3.2 this year + 3.6
Median Price – UP +5%
 With inventory at 4,282 units it is the highest it has been all year. In fact it was December 2011 since we had that many homes for sale in Pierce County. At that time we were steadily coming off the crazy high level of inventory that was the result of the housing crisis which peaked in August of 2007 at 9,022 units for sale. So how much inventory should we have? To have a balanced market, we need 3-5 months worth of inventory. In the last 14 years, which includes pre and post bubble markets, Pierce County has sold an average of 11,766 homes per year. Using that average we have 4.4 months inventory. Pendings are up 21% as we close out the summer so we may exceed 12,000 units with a strong finish in 2014.
 The peak of the Pierce County price index was 7 years ago! It has taken a long time to work through the huge impact of the housing market spinning out of control. Prices fell consistently for 5 years until reaching bottom in February 2012 and as of this month we are 39% up from that low! We've seen peak inventory levels as mentioned above when we had as much as 12 months worth on inventory and we've seen shortages like in March of 2013 with only 2,800 units for sale. It is refreshing to be at or near a normal inventory level!

Our recovery experience is comparable to other parts of the country. This CoreLogic map shows the State of Washington still 10.8% below it's peak market levels compared to other parts of the country that are either fully recovered or, like hard hit Nevada, still down over 37%. Ouch! It's always a good idea to break the numbers down to more localized evaluation and in this case I can tell you Pierce County is still 18% below the peak. What's interesting is Pierce County is at the same price level as June of 2005 while King County is at June 2006. With King County that much closer to the all time high, doesn't it seem logical that more of those buyers will be exploring Pierce County?

The road ahead. The Home Price Expectation Survey is a nationwide panel of over 100 economists, real estate experts, and investment or market strategists. I like this report because it is not the opinion of just one market expert, but a cumulative average of over 100 experts. Their 3rd quarter report is out and the graph is posted here. If Pierce County continues to generally follow the pattern of the rest of the country we will see cumulative appreciation of over 18% by the end of year 2018. This would put the Pierce County median price at about $280,000.
If you're a buyer in this market you can make your purchase decision with confidence that you're making a good long term investment. If you're a seller it is nice to know there is a balanced market with predictable fundamentals and a pool of buyers you can strike a deal with!
Pierce County Real Estate continues to lag behind King County
The Pierce County real estate market continues to lag behind King County, but there is light at the end of the tunnel and values are approaching 2004 – 2005 levels. For more details see the full article that was on yesterday's front page of the News Tribune.
Thousands in Pierce County trapped in underwater mortgages
Spring 2014 Pierce County Housing Report
Normalization continues, look who's buying and selling!
And where are rates headed?
The Pierce County Housing Market as measured by April 2014 numbers looks pretty benign and one might be tempted to believe the national headlines that the market is slowing down. Not so fast! Here are the numbers followed by a look inside the data that might surprise you!
Inventory – UP +17%
Closings – Down -7%
Pending Sales – UP +4%
Months of Inventory – UP last year 3 this year 3.7
Median Price – UP 13%

The stats above are not too impressive, maybe indicating the Pierce County Housing Market is neutral, and in a sideways crawl. To be honest I thought the same at first, and that is why I didn't check in with my report last month (My apologies to the 4 of you that missed it! lol!). Sometimes the real story is inside the numbers.
Normalization of the Pierce County Housing Market is evident. With falling distressed sale transactions and a substantial increase in upper end price ranges. This tells the story of the return of repeat sellers willing to resume participation in the market. Take a look at the breakdown of Pierce County sales by price range and what jumps out is the spike on the $350,000 to $500,000 price range.
 Although the overall numbers are not showing the big year over year gains we watched for most of last year, we can safely observe the market is more balanced and not just fueled by first time buyers and investors. Look below at how the makeup of sales is trending as measured by April numbers.

No Surprise – Rates will be going up – but when? By the end of 2015 Fannie Mae projects mortgage rates will be 5% while Freddie Mac's projection is 5.7% and Mortgage Bankers Association is 5.3%. The consensus is unanimous as to the direction of rates, the question is when. If Freddie Mac is correct with their projections the graph below is what we can expect.
 You've heard it before – "Even a rate in the 5's is great when compared to historical levels" While this is true, I found the chart below helpful in providing perspective. It shows that rates affect the "cost" of housing. Significant shifts in how much a monthly payment costs a homeowner can happen with a swing in rates.
 Possibly the greatest buying opportunity of a generation that was created by the Great Recession will be something we all talk about in the future. How soon that day comes is yet to be determined but it is clear we are still in a great window of opportunity.
 Despite recent gains, Pierce County still remains 21% below the peak median price, couple that with rates in the 4's one can say that both the Price and the Cost of a new home are very attractive!


