 Facebook
 X
X
 Pinterest
 Copy Link
October 2014 Pierce County Housing Report
It's that time again to check in on the Pierce County Housing Market. This month we have another neutral month based on the year over year stats I always lead off with, but I also found a few goblins we may want to keep an eye on. Here are the headline numbers as measured on September 30:
Inventory – UP 6.5%
Closings – UP 9.1%
Median Price – UP 1.4%
New Pending Contracts – 31.7%
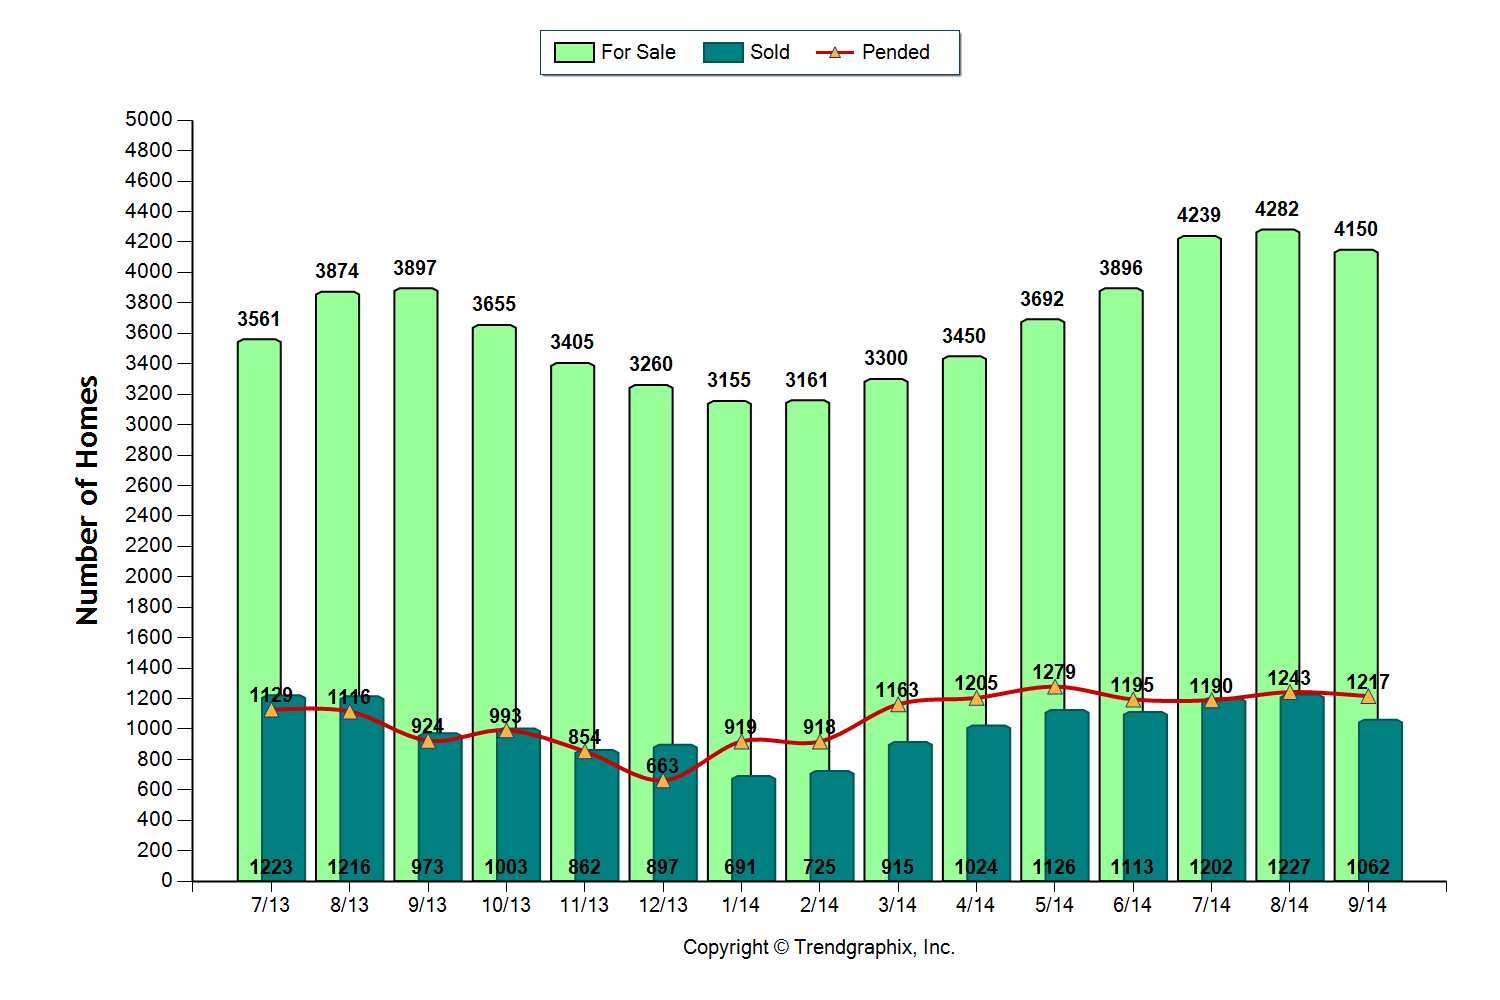
These are Year Over Year Numbers and they look pretty good. Inventory is UP, we like that, the market needs more houses to sell as we still have less than 4 months supply based on closed sales. Median Price is UP only slightly but that's not a surprise, we talked last month about price increases slowing. Pending contracts are UP so much that it is a great indication we are in store for a strong sales flow during the 4th quarter as we wrap up 2014! While I prefer the pumpkin is "half full" viewpoint, I have to say the market hasn't "felt" like these numbers. When talking with other brokers recently, I've noticed some chatter about a slower market; so I dug a little deeper.
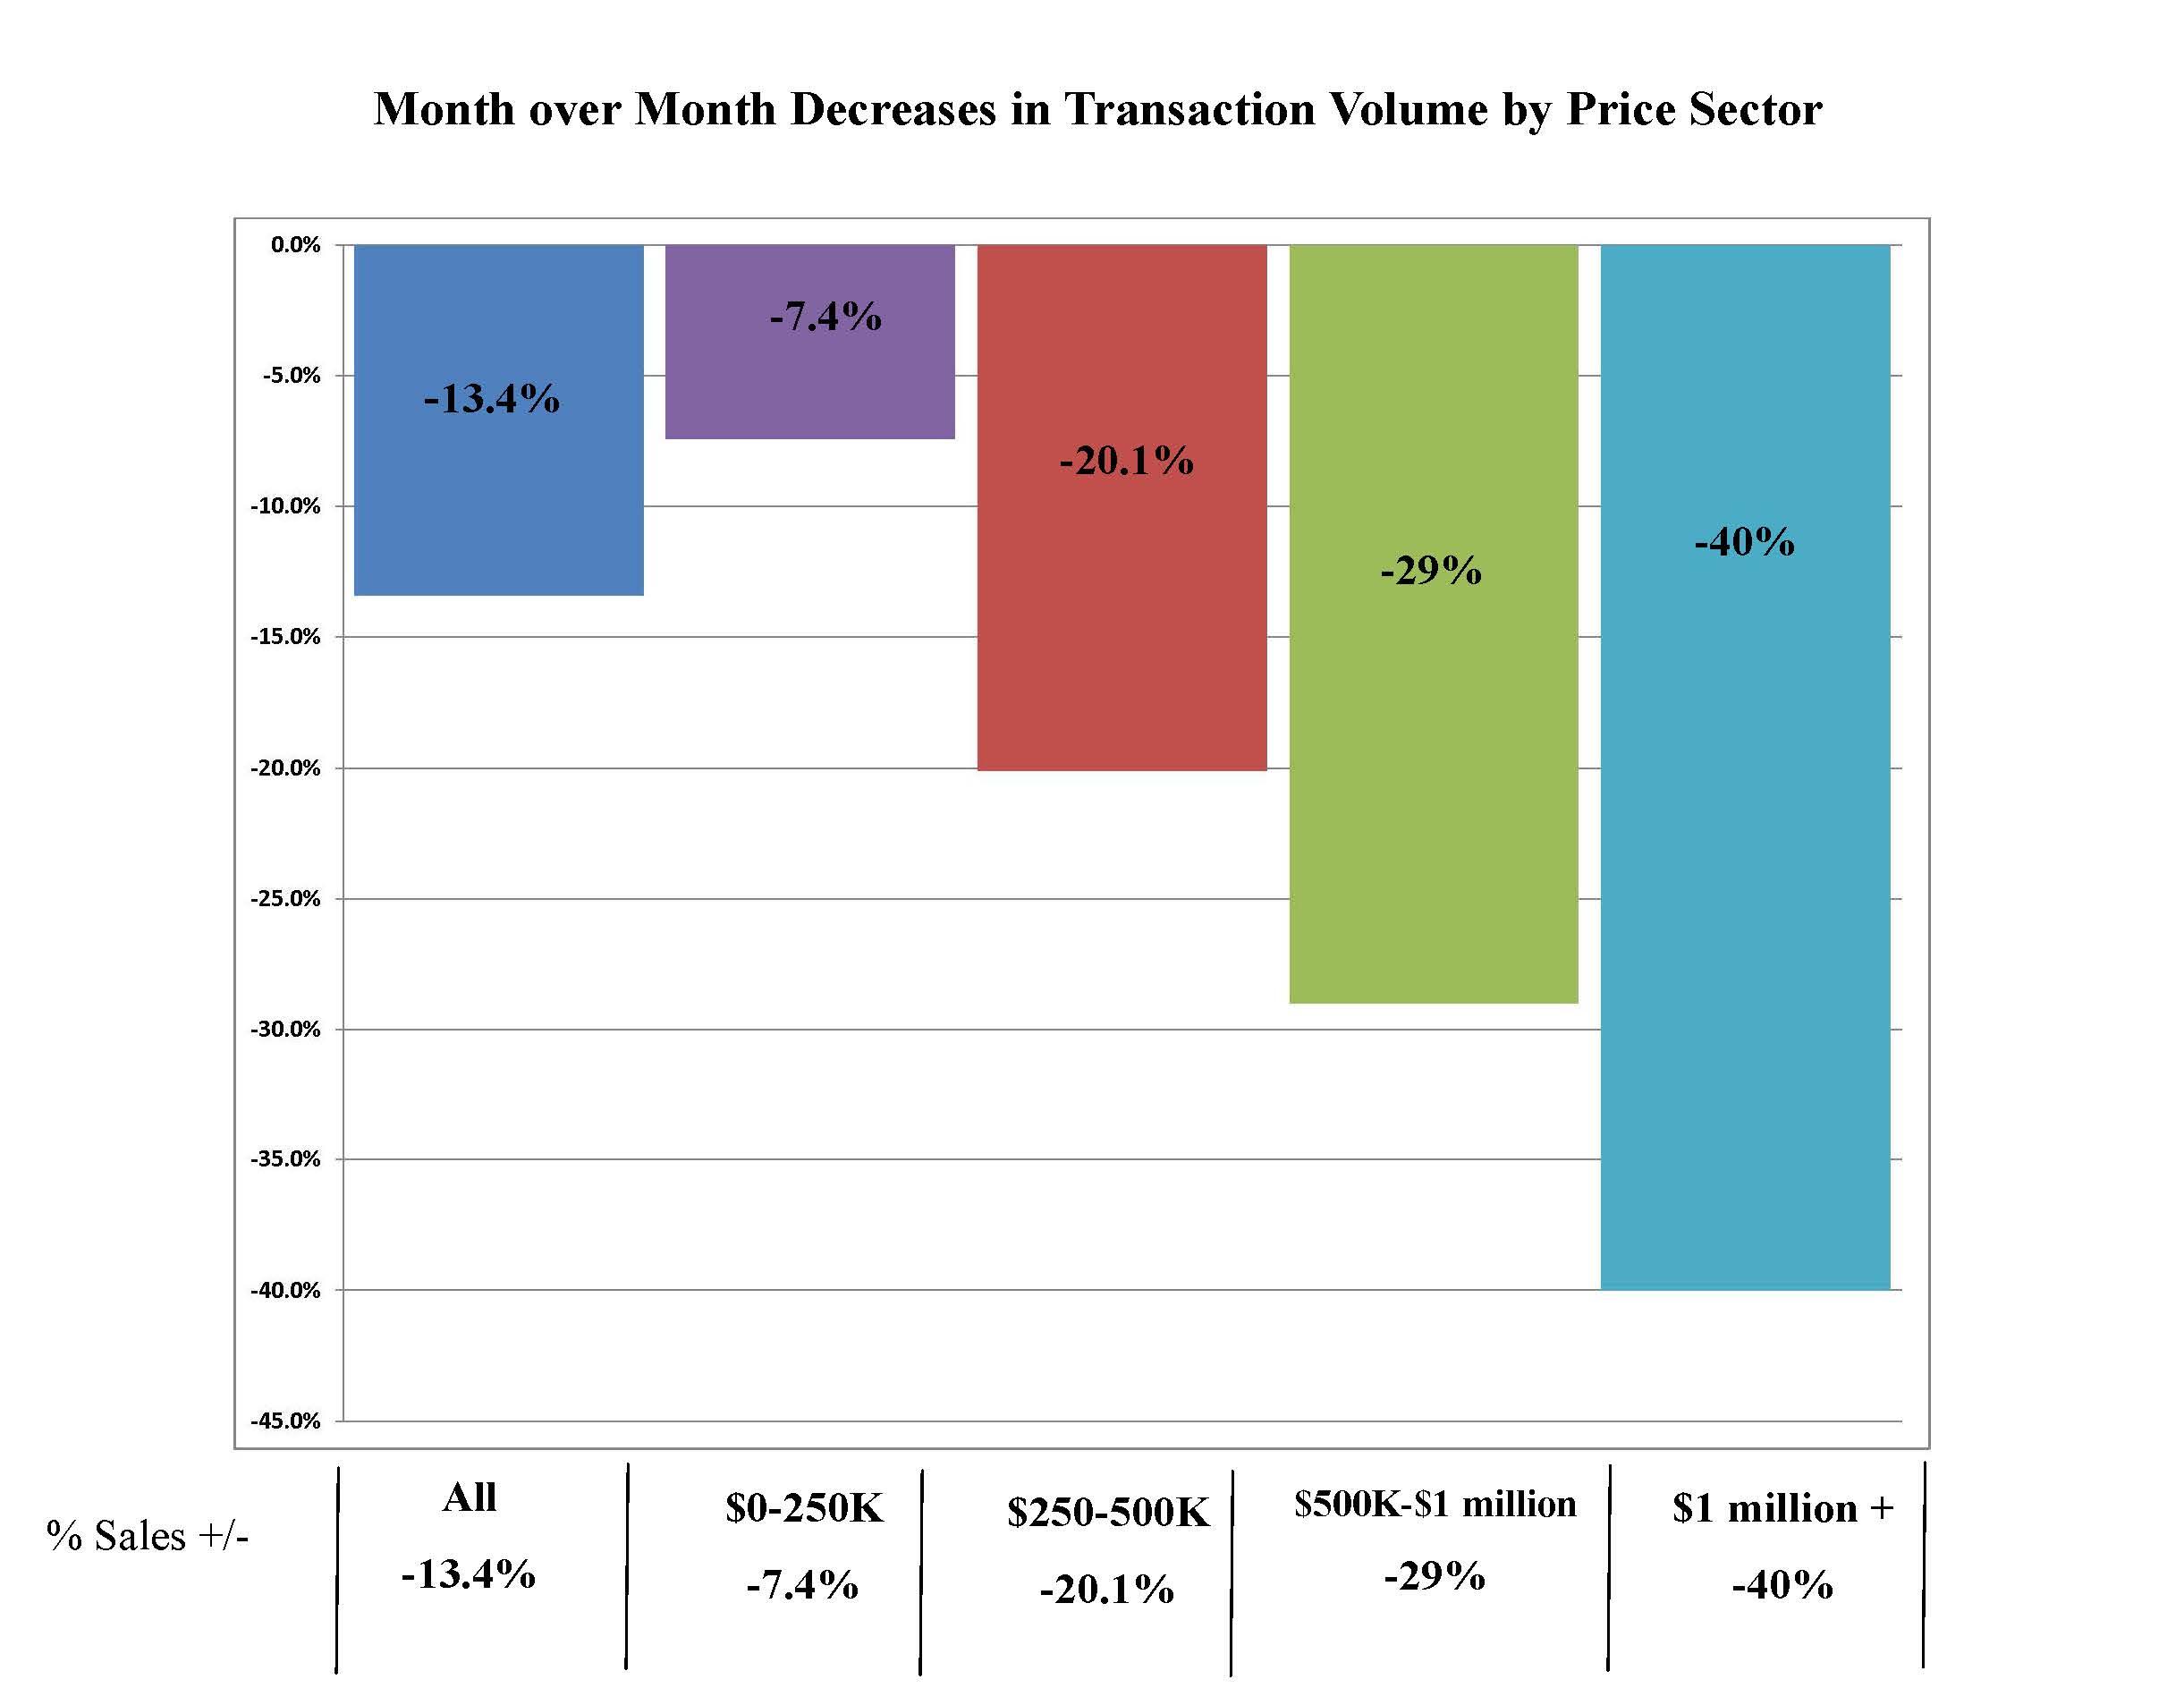
Month Over Month transaction volumes are much different with Pierce County DOWN 13.4%. Turns out this August vs September drop in closed sales is normal, at least compared to 2013 when the same thing happened. However in arriving at this conclusion I viewed the volumes by price range and saw a couple of items you may find interesting. In the chart above you can see the very important $250,000 – $500,000 price range things really took a break with volume dropping 20%. These are the homes that buyers are "moving up to" and it is just this year we have been able to say the recovery took hold in this sector. This segment of the market represents over 35% of our Pierce County transaction volume. I don't know if it is widely understood that 95.7% of the Pierce County Market happens in this price sector….and below!
![]()
This shows that only 4.4% of all Pierce County transactions were over $500,000. In case you were wondering, listing inventory over $500,000 disproportionately makes up 13.3% of the total number of homes for sale. Pierce County Housing Market participants need to know, the "Work-Horse" price sector is under $250,000 with 41% of the inventory creating over 60% of the sales!
We have a healthy volume of Pending Sales so if history repeats itself the coming months should provide a nice increase as we wrap up 2014.
September's numbers are a fitting reminder that there's a limit to how robust our recovery can be characterized.
Month by month we are achieving normalization and as I've always said; "markets don't recover in a straight line" so there may be a bump in the road from time to time. Those that approach this market with realistic expectations based on detailed market analysis will find success.
Give me a call or shoot me an email, it is always good to hear from you!
Post Summer 2014 Pierce County Housing Report
Evidence of Slowing Appreciation and Reversion to Normalcy.
Also, how King County's trending may soon affect our local market.
Markets Continually Seek Balance The Pierce County Housing market as measured by August 2014 numbers gives us a clear indication it is efficiently balancing and allowing home buyers and sellers to participate with predictable results.
Inventory – UP +11%
Closings – Down -02%
Pending Sales – UP +21%
Months of Inventory – UP last year +3.2 this year + 3.6
Median Price – UP +5%
 With inventory at 4,282 units it is the highest it has been all year. In fact it was December 2011 since we had that many homes for sale in Pierce County. At that time we were steadily coming off the crazy high level of inventory that was the result of the housing crisis which peaked in August of 2007 at 9,022 units for sale. So how much inventory should we have? To have a balanced market, we need 3-5 months worth of inventory. In the last 14 years, which includes pre and post bubble markets, Pierce County has sold an average of 11,766 homes per year. Using that average we have 4.4 months inventory. Pendings are up 21% as we close out the summer so we may exceed 12,000 units with a strong finish in 2014.
 The peak of the Pierce County price index was 7 years ago! It has taken a long time to work through the huge impact of the housing market spinning out of control. Prices fell consistently for 5 years until reaching bottom in February 2012 and as of this month we are 39% up from that low! We've seen peak inventory levels as mentioned above when we had as much as 12 months worth on inventory and we've seen shortages like in March of 2013 with only 2,800 units for sale. It is refreshing to be at or near a normal inventory level!

Our recovery experience is comparable to other parts of the country. This CoreLogic map shows the State of Washington still 10.8% below it's peak market levels compared to other parts of the country that are either fully recovered or, like hard hit Nevada, still down over 37%. Ouch! It's always a good idea to break the numbers down to more localized evaluation and in this case I can tell you Pierce County is still 18% below the peak. What's interesting is Pierce County is at the same price level as June of 2005 while King County is at June 2006. With King County that much closer to the all time high, doesn't it seem logical that more of those buyers will be exploring Pierce County?

The road ahead. The Home Price Expectation Survey is a nationwide panel of over 100 economists, real estate experts, and investment or market strategists. I like this report because it is not the opinion of just one market expert, but a cumulative average of over 100 experts. Their 3rd quarter report is out and the graph is posted here. If Pierce County continues to generally follow the pattern of the rest of the country we will see cumulative appreciation of over 18% by the end of year 2018. This would put the Pierce County median price at about $280,000.
If you're a buyer in this market you can make your purchase decision with confidence that you're making a good long term investment. If you're a seller it is nice to know there is a balanced market with predictable fundamentals and a pool of buyers you can strike a deal with!
Pierce County Real Estate continues to lag behind King County
The Pierce County real estate market continues to lag behind King County, but there is light at the end of the tunnel and values are approaching 2004 – 2005 levels. For more details see the full article that was on yesterday's front page of the News Tribune.
Thousands in Pierce County trapped in underwater mortgages
Spring 2014 Pierce County Housing Report
Normalization continues, look who's buying and selling!
And where are rates headed?
The Pierce County Housing Market as measured by April 2014 numbers looks pretty benign and one might be tempted to believe the national headlines that the market is slowing down. Not so fast! Here are the numbers followed by a look inside the data that might surprise you!
Inventory – UP +17%
Closings – Down -7%
Pending Sales – UP +4%
Months of Inventory – UP last year 3 this year 3.7
Median Price – UP 13%

The stats above are not too impressive, maybe indicating the Pierce County Housing Market is neutral, and in a sideways crawl. To be honest I thought the same at first, and that is why I didn't check in with my report last month (My apologies to the 4 of you that missed it! lol!). Sometimes the real story is inside the numbers.
Normalization of the Pierce County Housing Market is evident. With falling distressed sale transactions and a substantial increase in upper end price ranges. This tells the story of the return of repeat sellers willing to resume participation in the market. Take a look at the breakdown of Pierce County sales by price range and what jumps out is the spike on the $350,000 to $500,000 price range.
 Although the overall numbers are not showing the big year over year gains we watched for most of last year, we can safely observe the market is more balanced and not just fueled by first time buyers and investors. Look below at how the makeup of sales is trending as measured by April numbers.

No Surprise – Rates will be going up – but when? By the end of 2015 Fannie Mae projects mortgage rates will be 5% while Freddie Mac's projection is 5.7% and Mortgage Bankers Association is 5.3%. The consensus is unanimous as to the direction of rates, the question is when. If Freddie Mac is correct with their projections the graph below is what we can expect.
 You've heard it before – "Even a rate in the 5's is great when compared to historical levels" While this is true, I found the chart below helpful in providing perspective. It shows that rates affect the "cost" of housing. Significant shifts in how much a monthly payment costs a homeowner can happen with a swing in rates.
 Possibly the greatest buying opportunity of a generation that was created by the Great Recession will be something we all talk about in the future. How soon that day comes is yet to be determined but it is clear we are still in a great window of opportunity.
 Despite recent gains, Pierce County still remains 21% below the peak median price, couple that with rates in the 4's one can say that both the Price and the Cost of a new home are very attractive!


