A Phenomenal Year for Real Estate is Underway!
The Market Recovery of 2012 was followed by Market Stabilization in 2013. Now it's time for Growth in 2014!
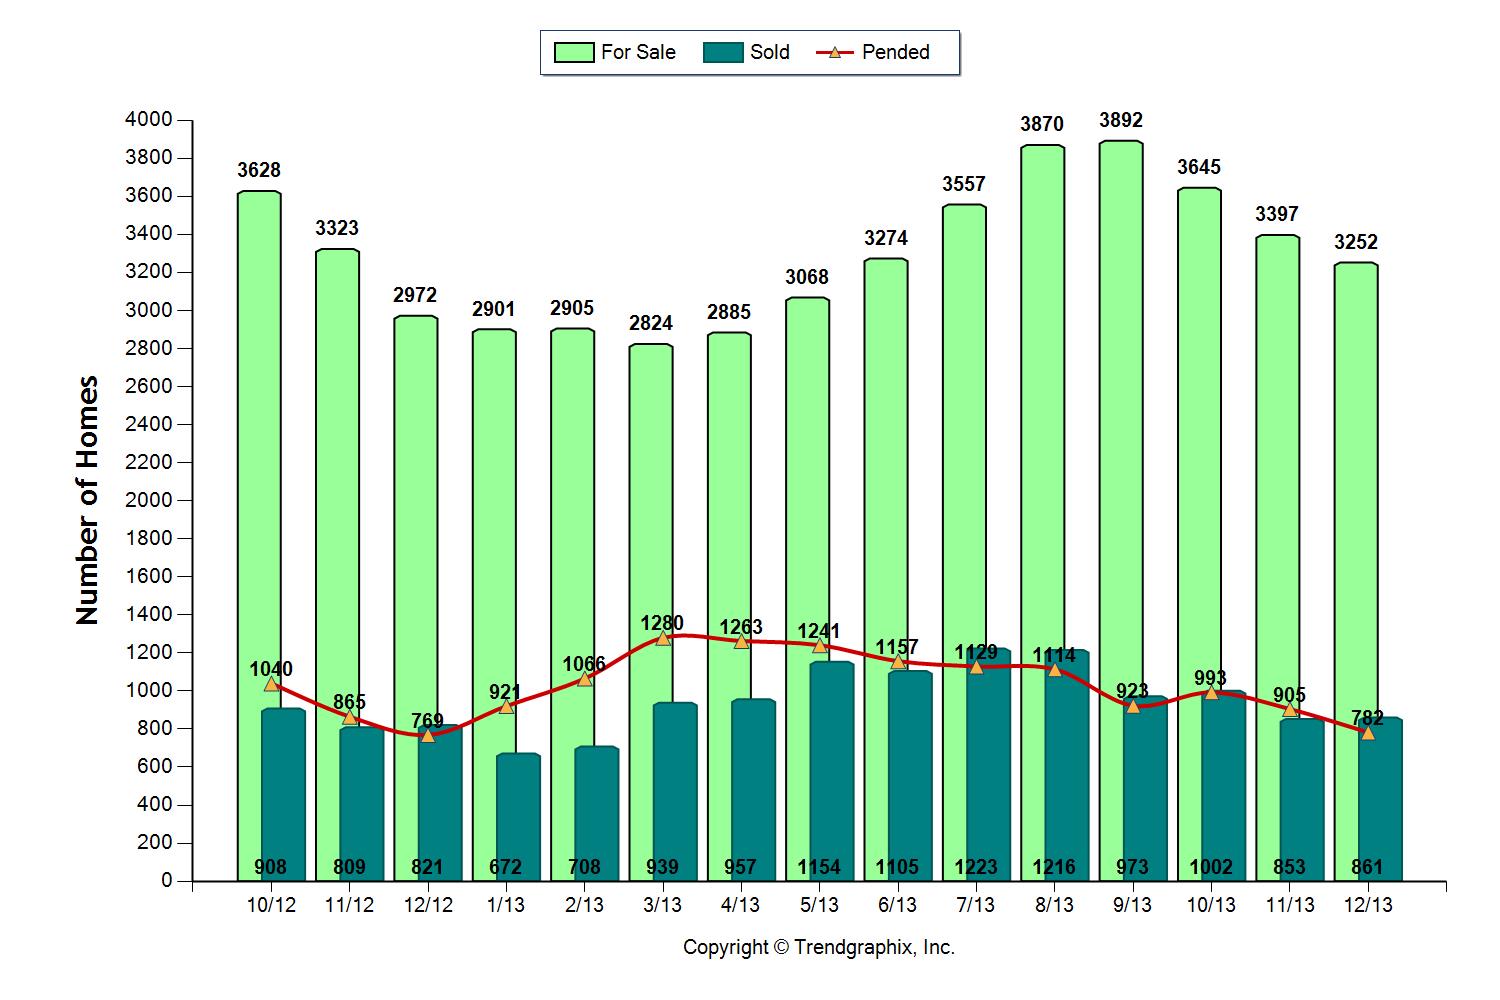
A look into what is driving our market in a moment, first here are the year over year numbers:
Inventory – UP 11.5%
Closings – UP 5%
Months of Inventory – Even last year 3.6 this year 3.8
Median Price – UP 2.2%
For several years I've talked about a steady recovery and stabilization period for our Pierce County Market while somewhat equal but opposing forces have been pushing and pulling the market. For example, many homeowners have outgrown their home, or their home has become too large with family changes, and they have been unwilling or unable to accept the re-calibrated market price of their home, and therefore not willing to make the move. While they were waiting there has been a steady supply of distressed properties on the market creating drag on prices. This has created a substantial "pent-up" demand that has started to find it's way to market. In some cases move up buyers are recognizing that even if they take a loss on the house they are selling, the bigger house they are buying is also much less and the difference works in their favor. We could all see that before, but few made the move, the difference now is "confidence". So 2014 promises to deliver one the most active, appreciating, and dynamic markets we have seen in years! Here are some reasons why:
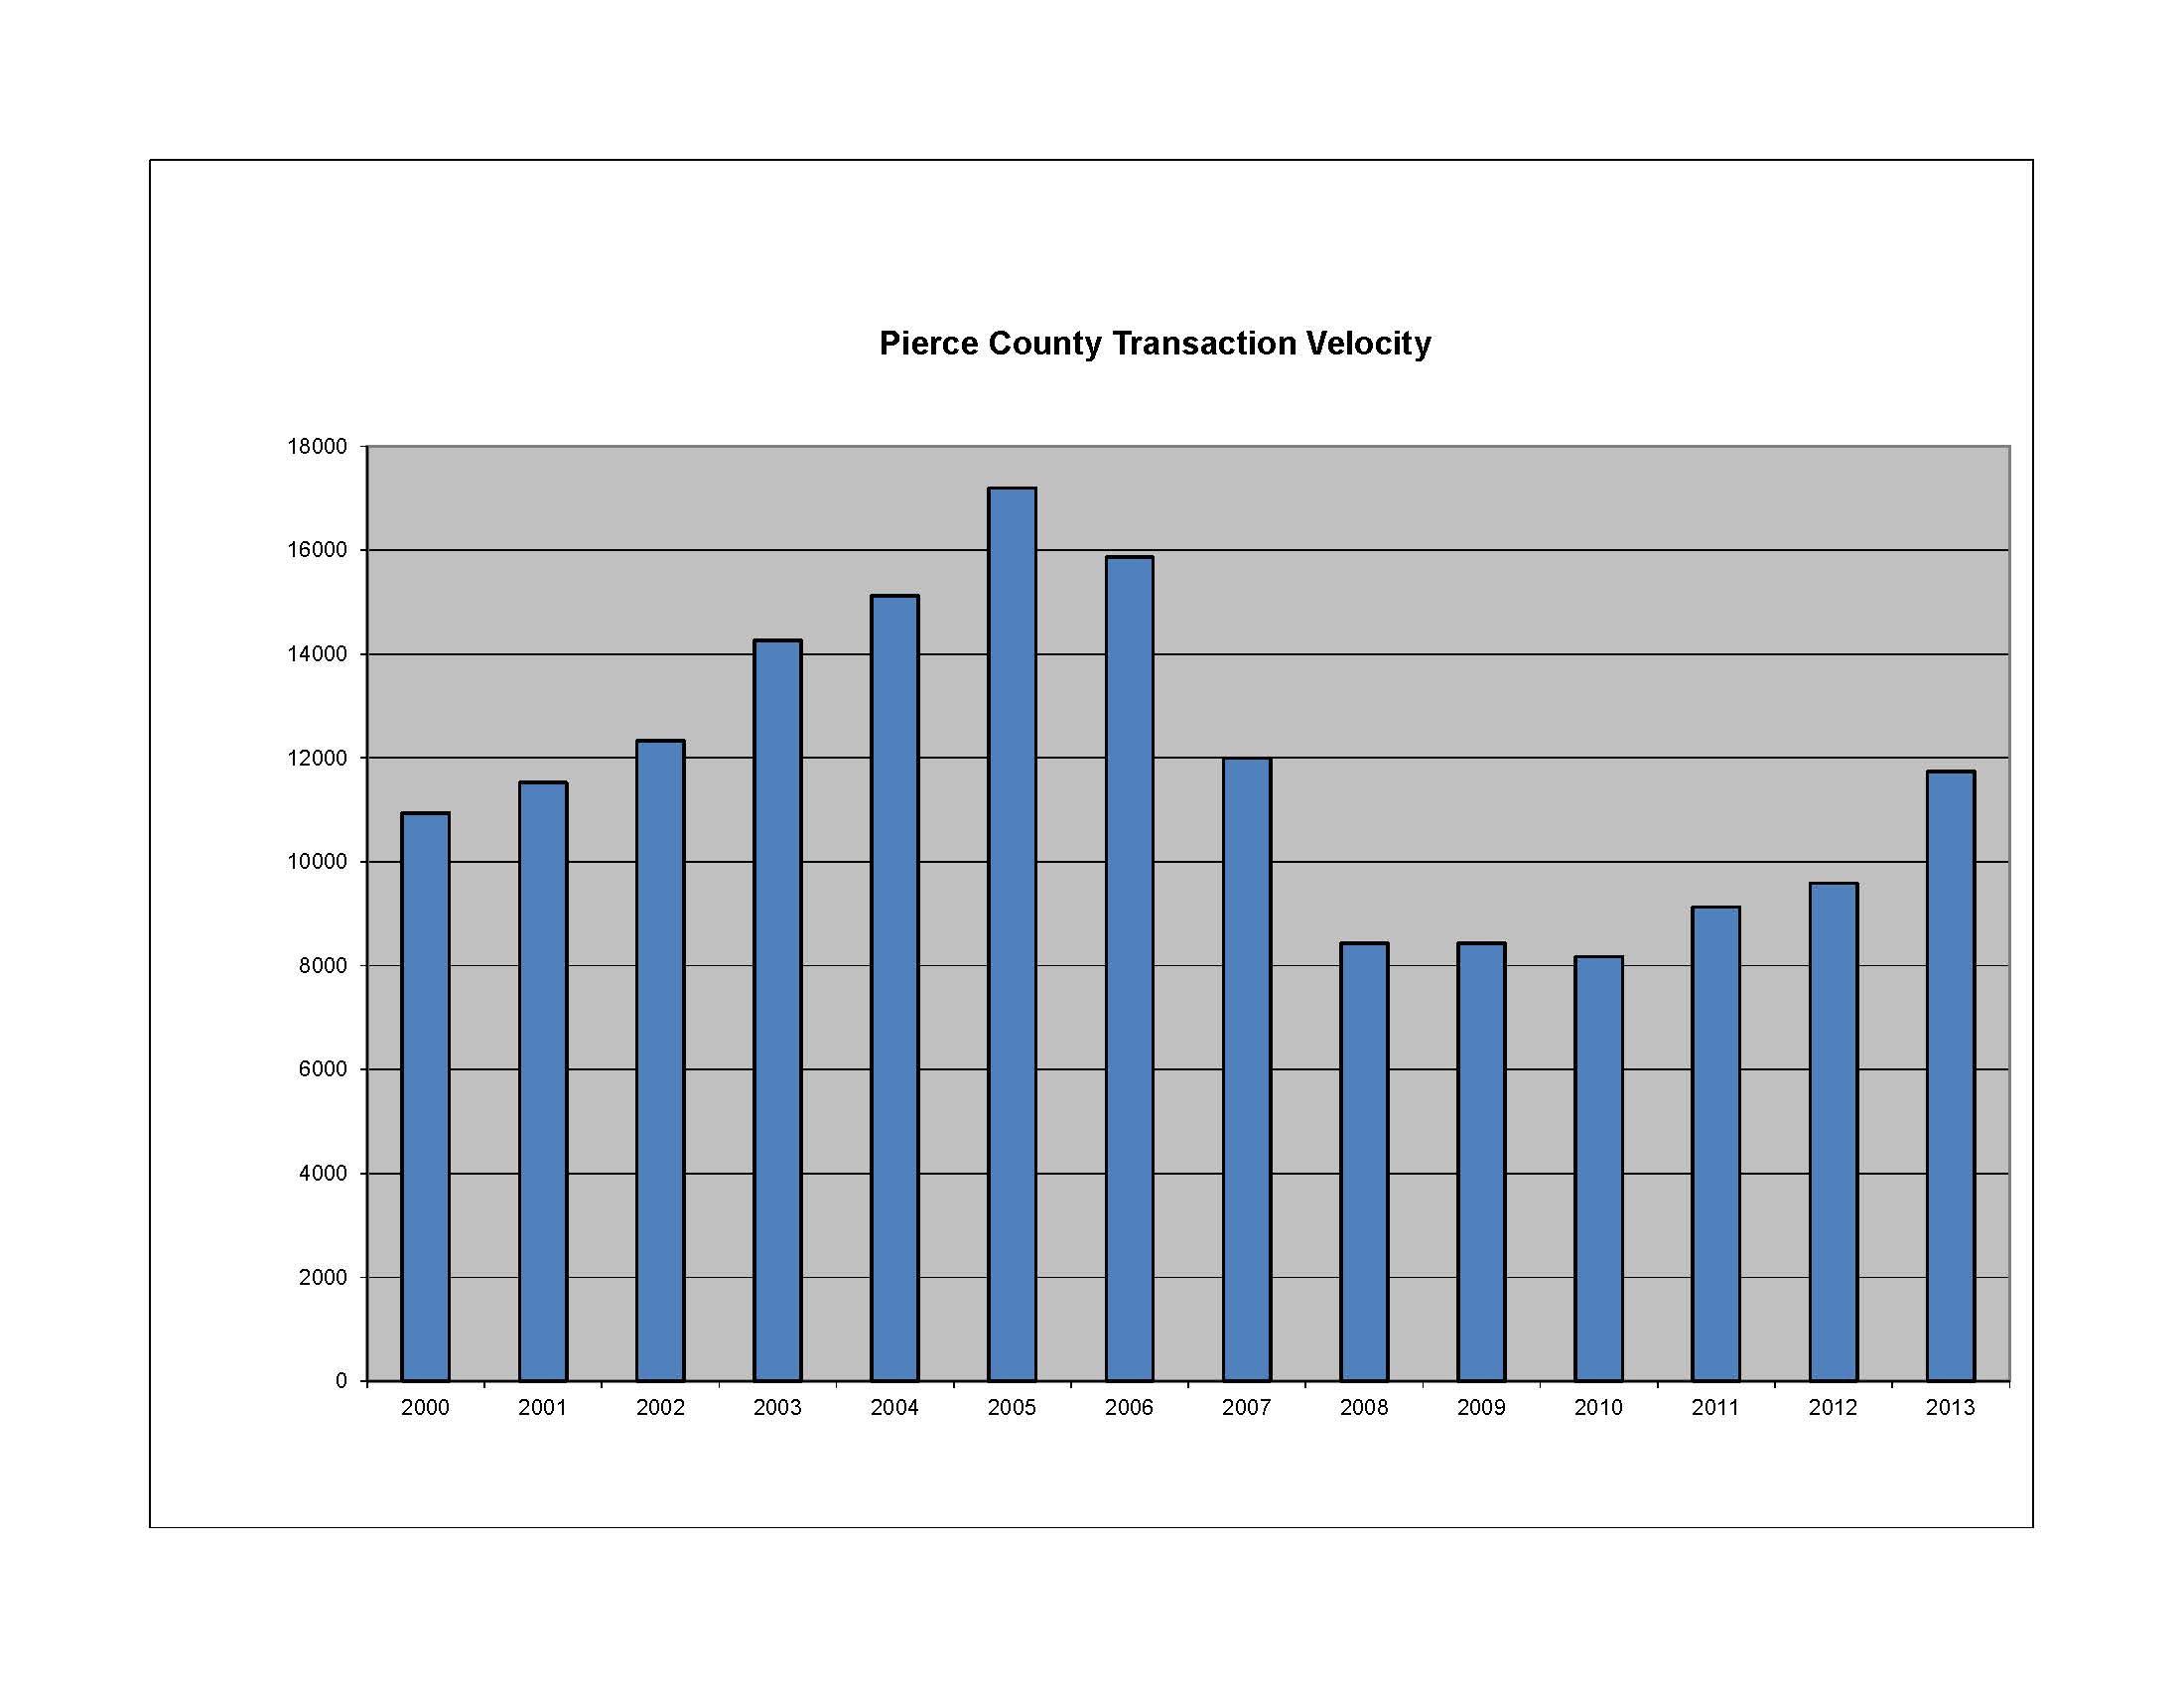
Transaction Velocity is at Normal Levels This is an update from last month now that 2013 numbers are final. For several years I have said that the market recovers in two ways – and one is always before the other. First is Transaction Velocity. The transaction volume (units sold) must come back into line with the traditional norm before we can have a full recovery and further appreciation of prices. Now that 2013 is in the books we know Pierce County transaction velocity was 11,737 units. That compares to a 12 year pre-bubble and post bubble average of 12,749. The chart below illustrates the fluctuations, 2013 volume is 22% greater than 2012 and 92% of the 12 year average! With this increased velocity the Days on Market that it takes a home to sell has gone from 86 days in 2012 to 71 days in 2013.
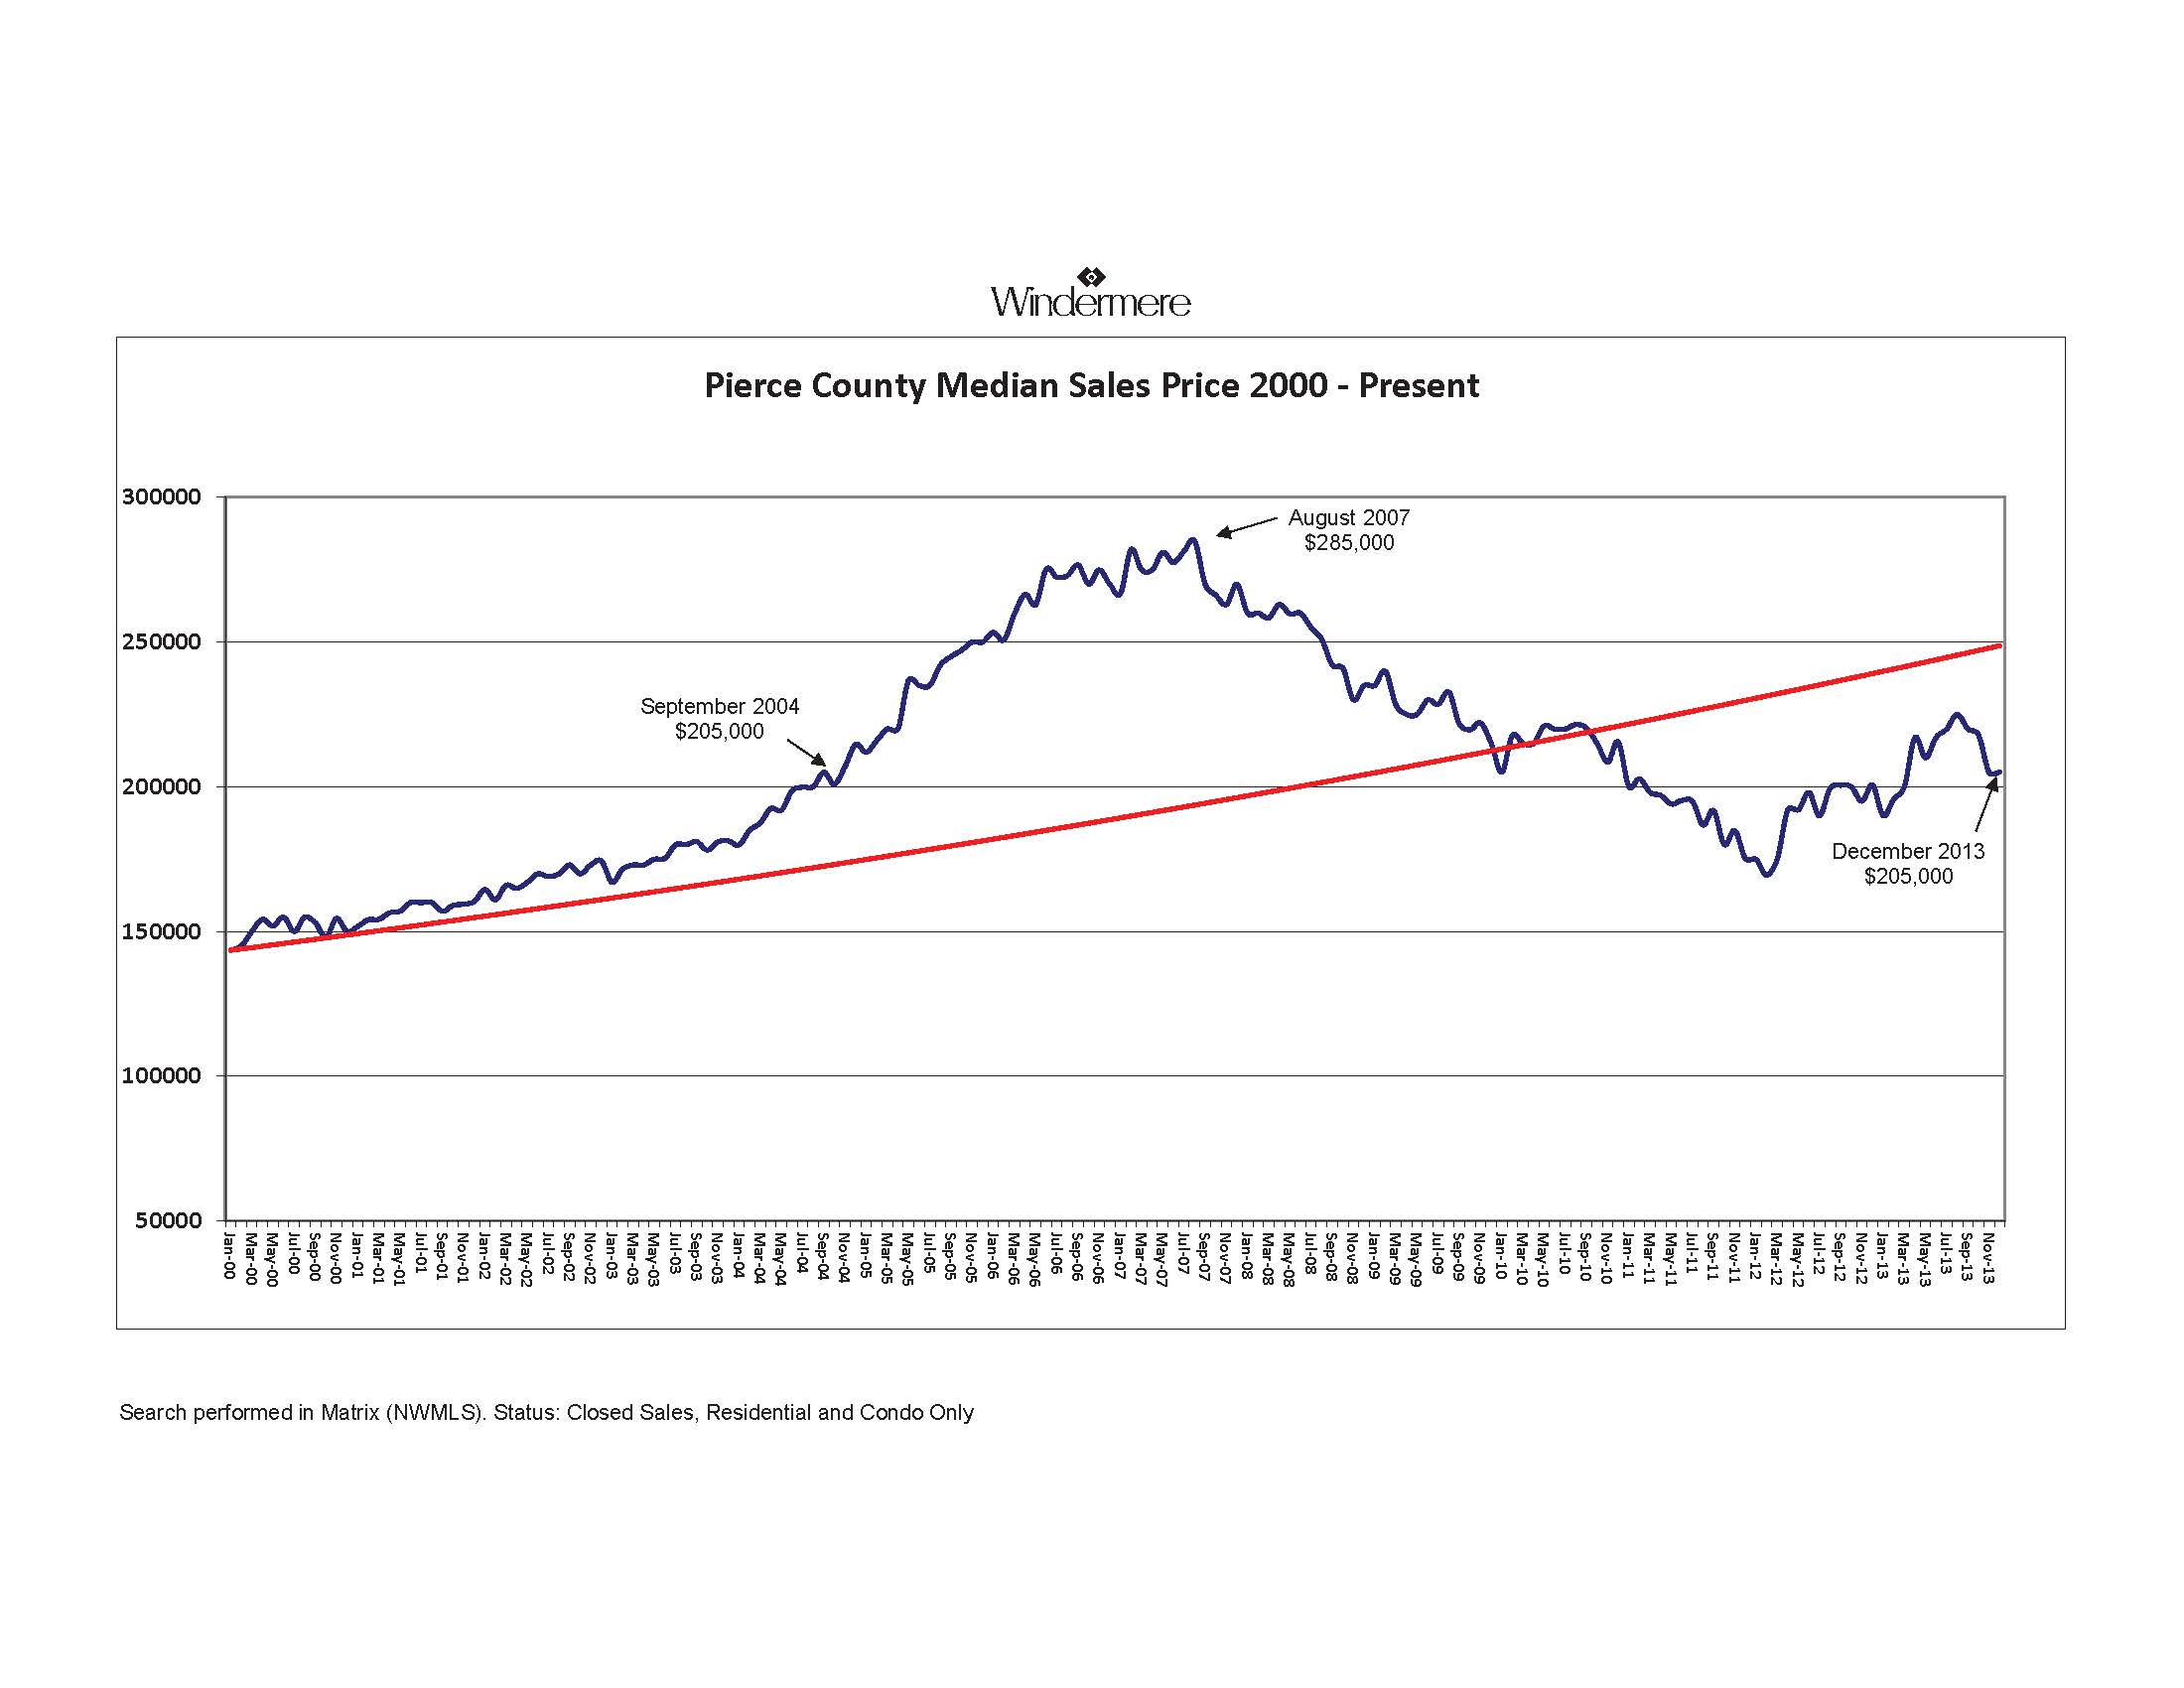
Prices Will Go Up in 2014 Faster Than 2013 The baseline on transaction velocity makes an indisputable case that demand for Pierce County Real Estate is back, for the most part thanks to 1st time buyers and investors. In 2014 the young 1st time buyers will increase their interest in home ownership but there will be an additional demand from existing homeowners moving up – moving down – moving out and so on! In 2013 the median closed price went up 7.9% from January to December. With every percentage point of appreciation a new group of homeowners are finding themselves "above water" on their mortgages and able to make the move they have been waiting for. As more of this positive equity is unlocked it will release a new contingent of buyers on the market. Pierce County is still 28% off of the peak median price we saw in August of 2007 but I think we are at a tipping point of demand and supply that will cause that gap to narrow more than any of the last 5 years. Markets seek equilibrium and chart below shows us Pierce County has been over-corrected and below the average appreciation line for a long time.
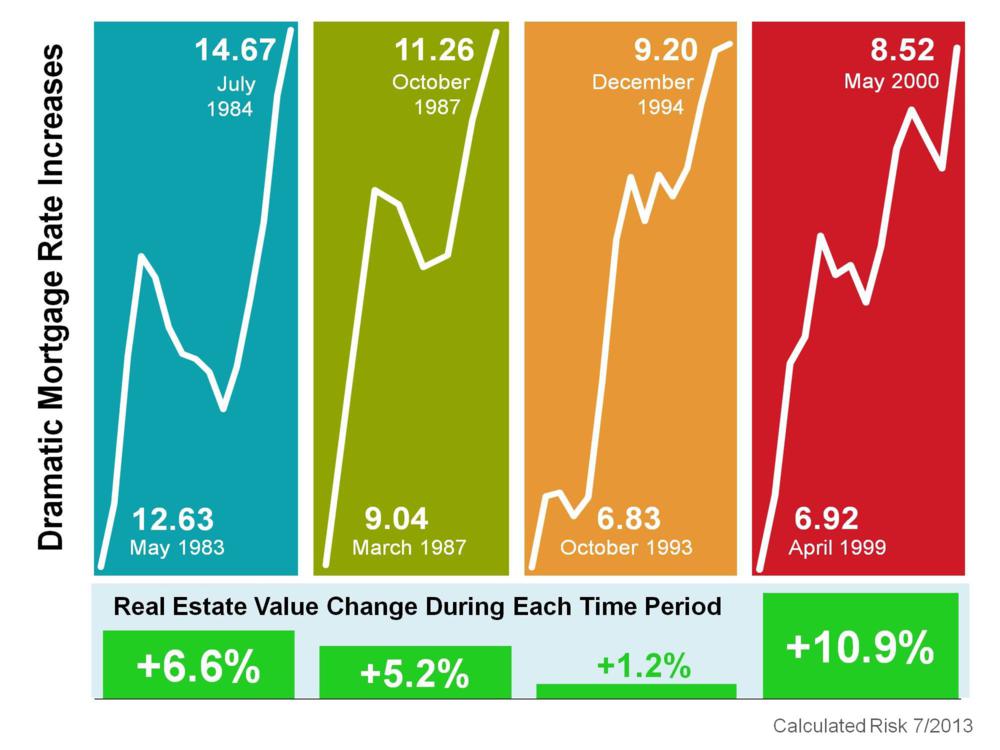
But What About the Fed and Interest Rates? For the last few months I have discussed the Federal Reserve tapering their robust purchasing of mortgage backed securities and the effect that will have on interest rates. Increases in mortgage rates cause the cost of housing to increase because most home purchasers obtain a mortgage loan when they buy. It has been predicted by some that as the Fed tapers (we know they will) and mortgage interest rates go up (we know they will) the increased cost will push prices back down. For my money, I wouldn't count on it. The Fed has demonstrated in the last 6 months that they are Über sensitive to not wrecking the hard won economic gains we are experiencing and housing recovery is central to the process. Further, if history is any lesson see the graphic below which demonstrates the last 4 economic cycles where we saw a rapid increase in interest rates, home prices actually went up! Part of the reason for this stems from the fact that the Fed raises interest rates as a balancing mechanism when the economy is good and people overall are doing well. While it is true housing will cost more and home buyers purchasing power erodes when rates go up, it has not been true in the past that it causes prices to go back down.
Let me know if you have any questions or comments – It's always great to hear from you!

 Facebook
 X
X
 Pinterest
 Copy Link


