Spring 2014 Pierce County Housing Report
Normalization continues, look who's buying and selling!
And where are rates headed?
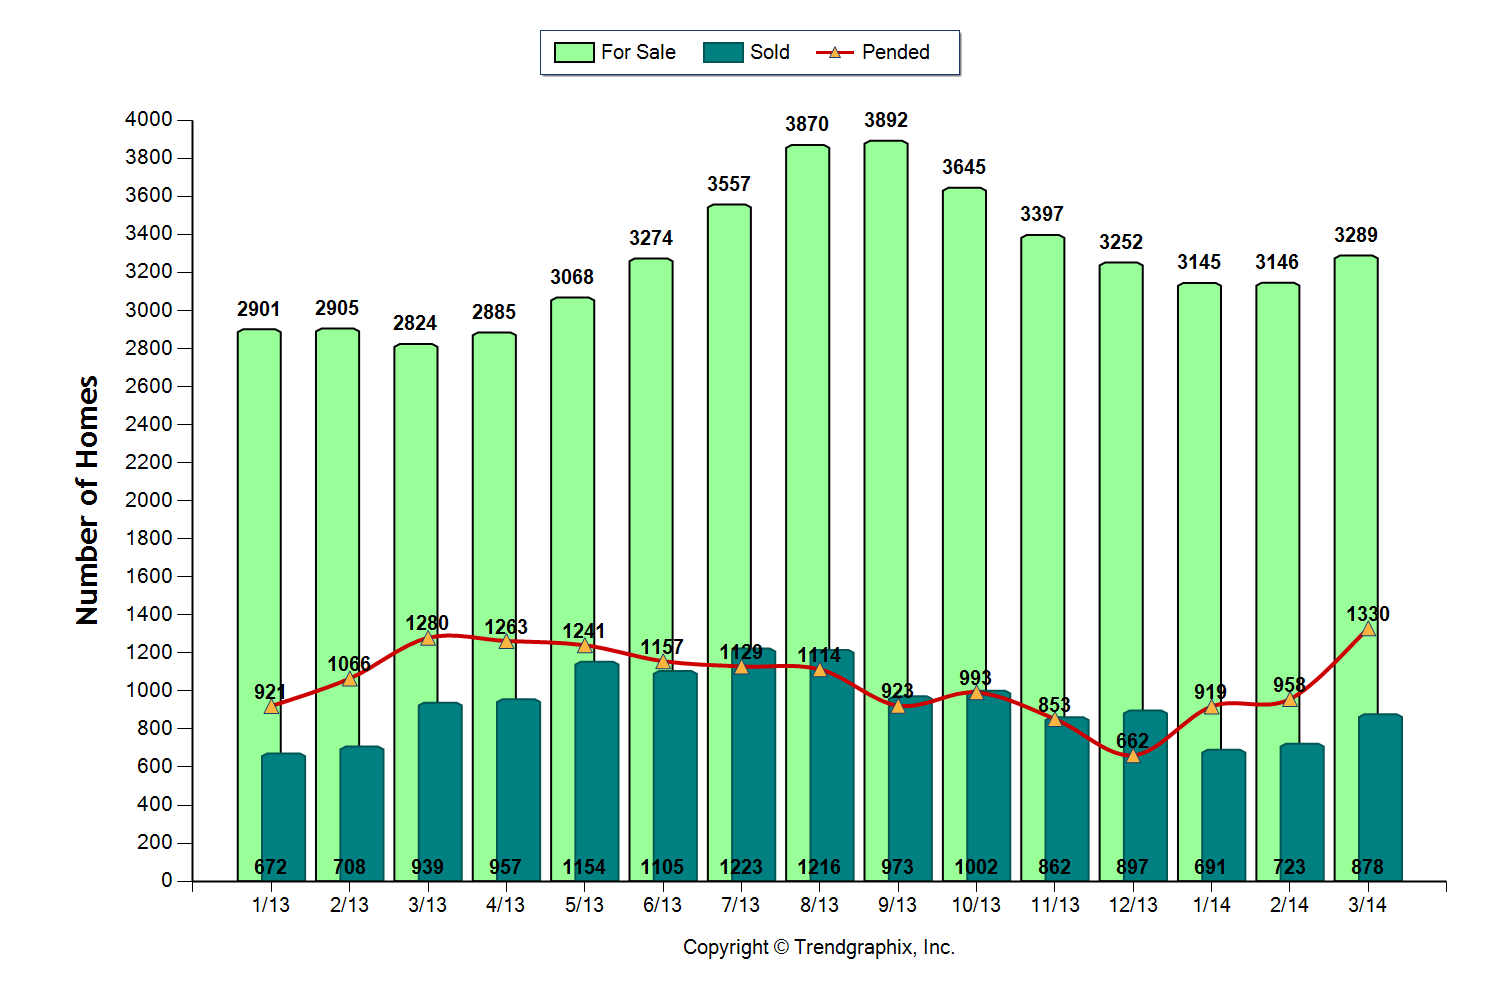
The Pierce County Housing Market as measured by April 2014 numbers looks pretty benign and one might be tempted to believe the national headlines that the market is slowing down. Not so fast! Here are the numbers followed by a look inside the data that might surprise you!
Inventory – UP +17%
Closings – Down -7%
Pending Sales – UP +4%
Months of Inventory – UP last year 3 this year 3.7
Median Price – UP 13%
The stats above are not too impressive, maybe indicating the Pierce County Housing Market is neutral, and in a sideways crawl. To be honest I thought the same at first, and that is why I didn't check in with my report last month (My apologies to the 4 of you that missed it! lol!). Sometimes the real story is inside the numbers.
Normalization of the Pierce County Housing Market is evident. With falling distressed sale transactions and a substantial increase in upper end price ranges. This tells the story of the return of repeat sellers willing to resume participation in the market. Take a look at the breakdown of Pierce County sales by price range and what jumps out is the spike on the $350,000 to $500,000 price range.
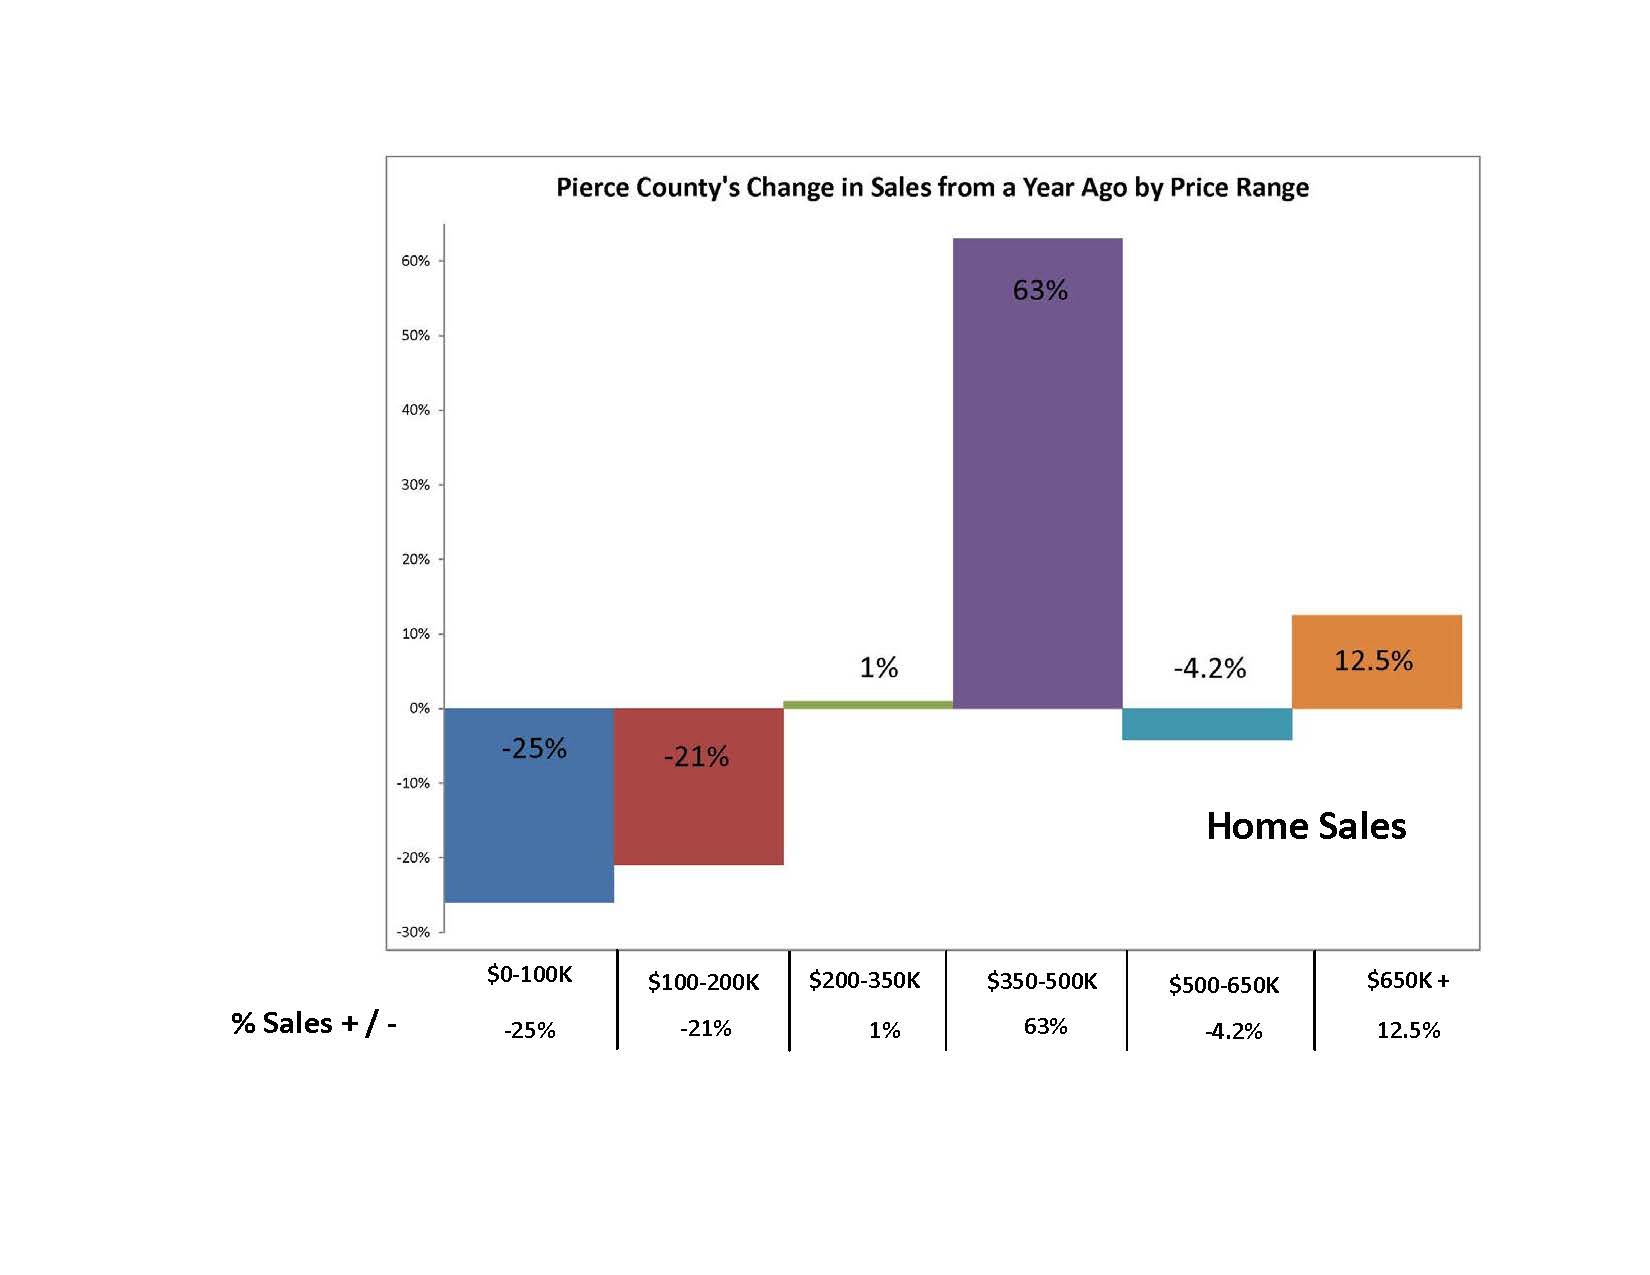 Although the overall numbers are not showing the big year over year gains we watched for most of last year, we can safely observe the market is more balanced and not just fueled by first time buyers and investors. Look below at how the makeup of sales is trending as measured by April numbers.
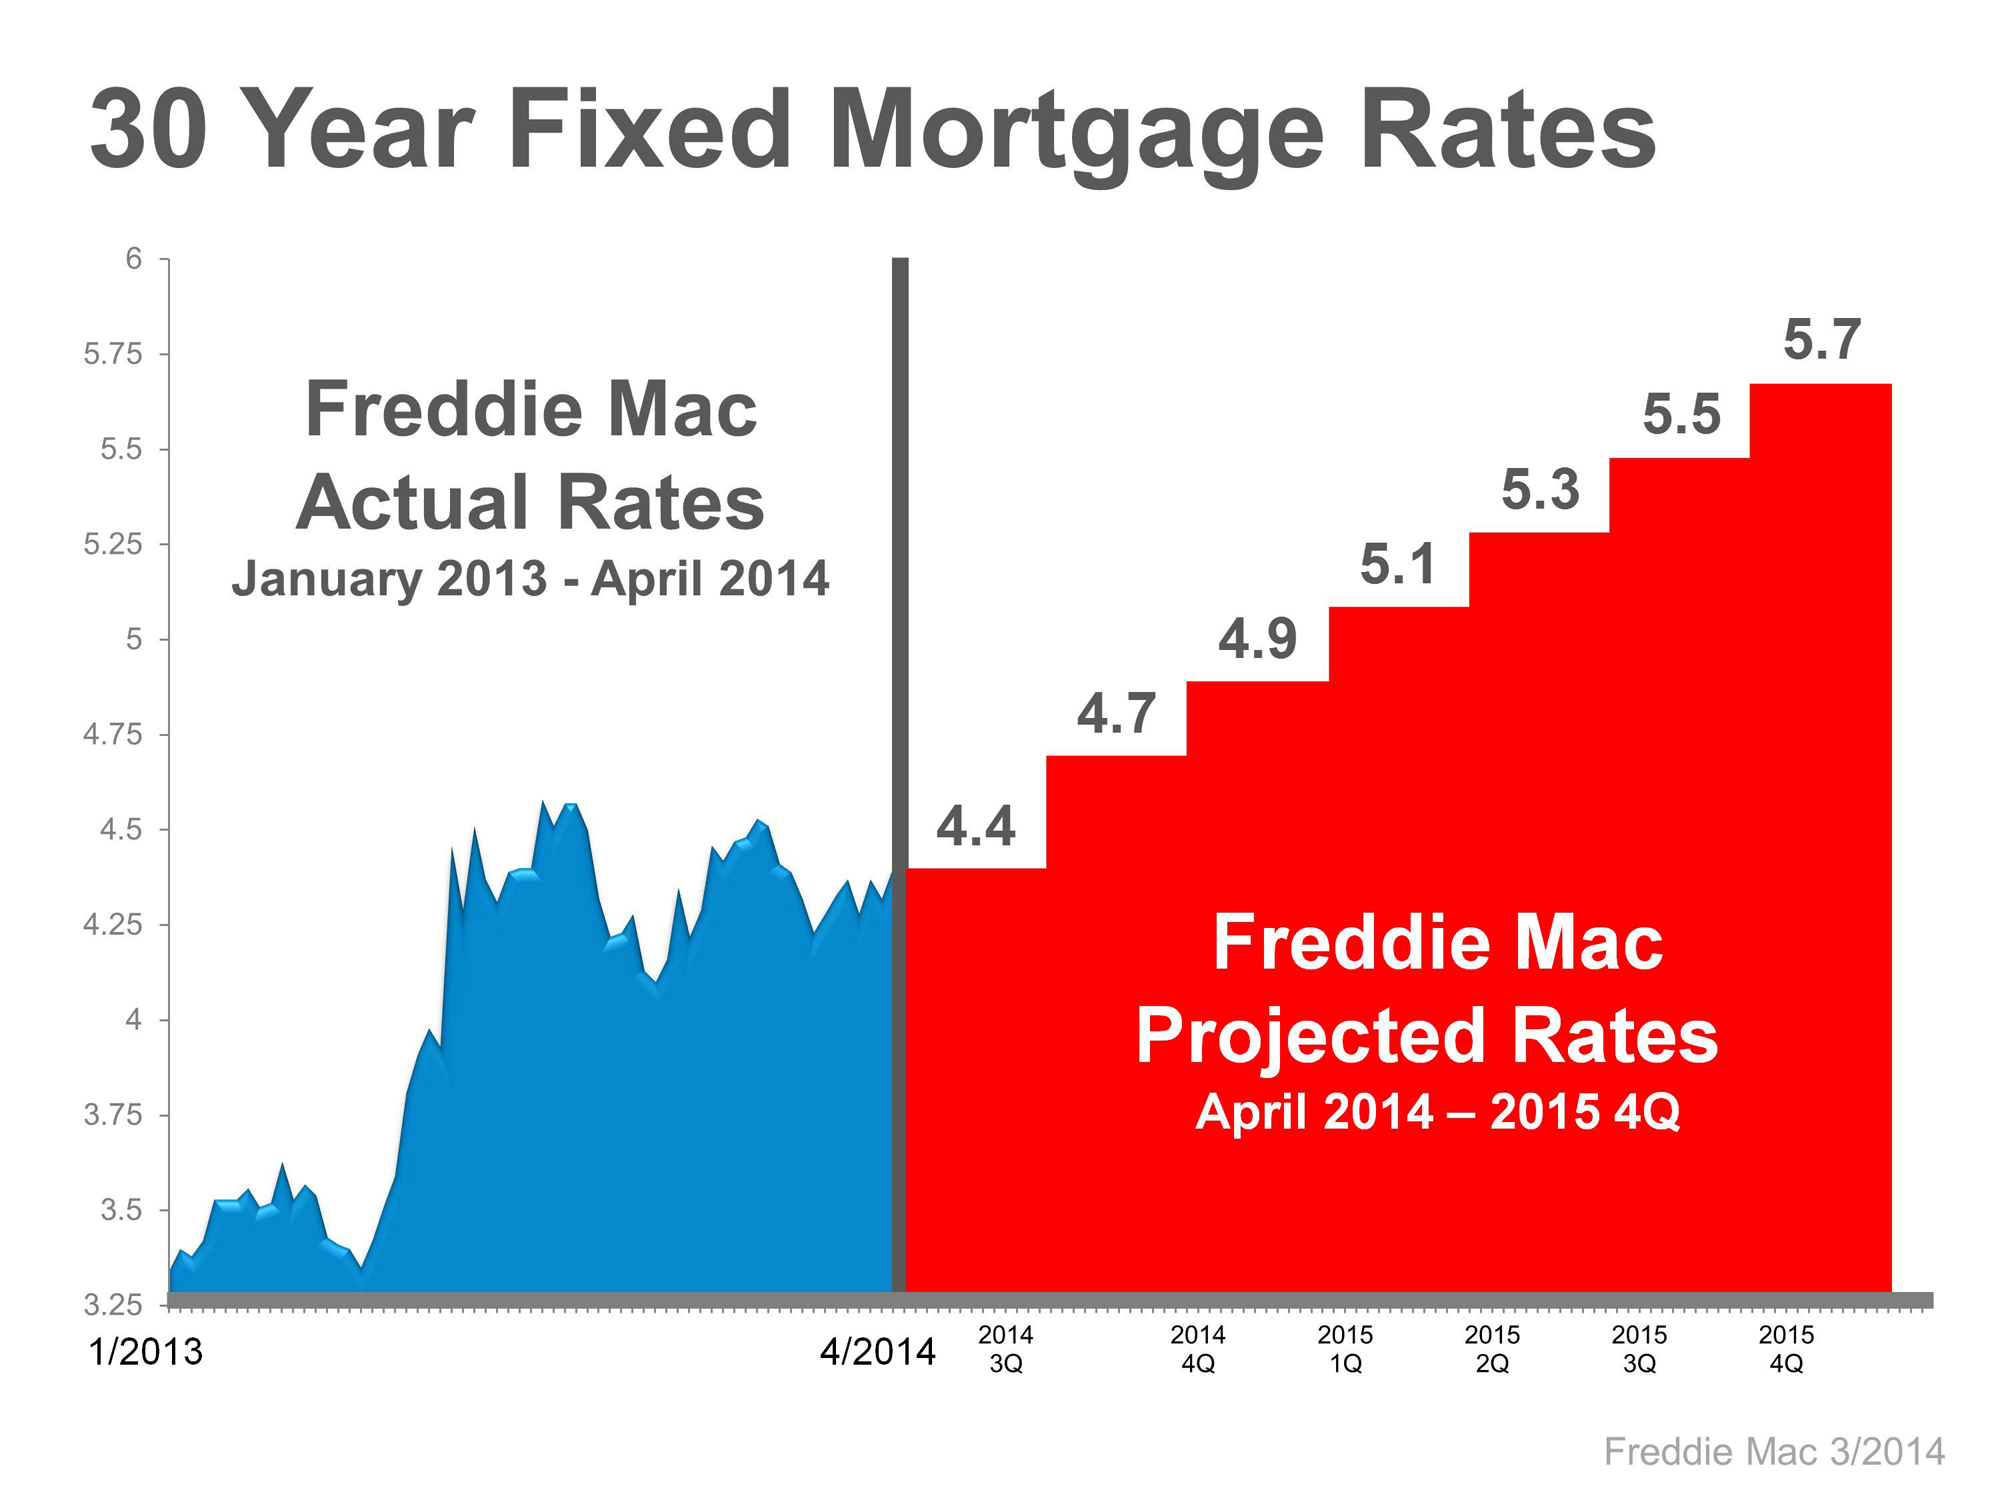
No Surprise – Rates will be going up – but when? By the end of 2015 Fannie Mae projects mortgage rates will be 5% while Freddie Mac's projection is 5.7% and Mortgage Bankers Association is 5.3%. The consensus is unanimous as to the direction of rates, the question is when. If Freddie Mac is correct with their projections the graph below is what we can expect.
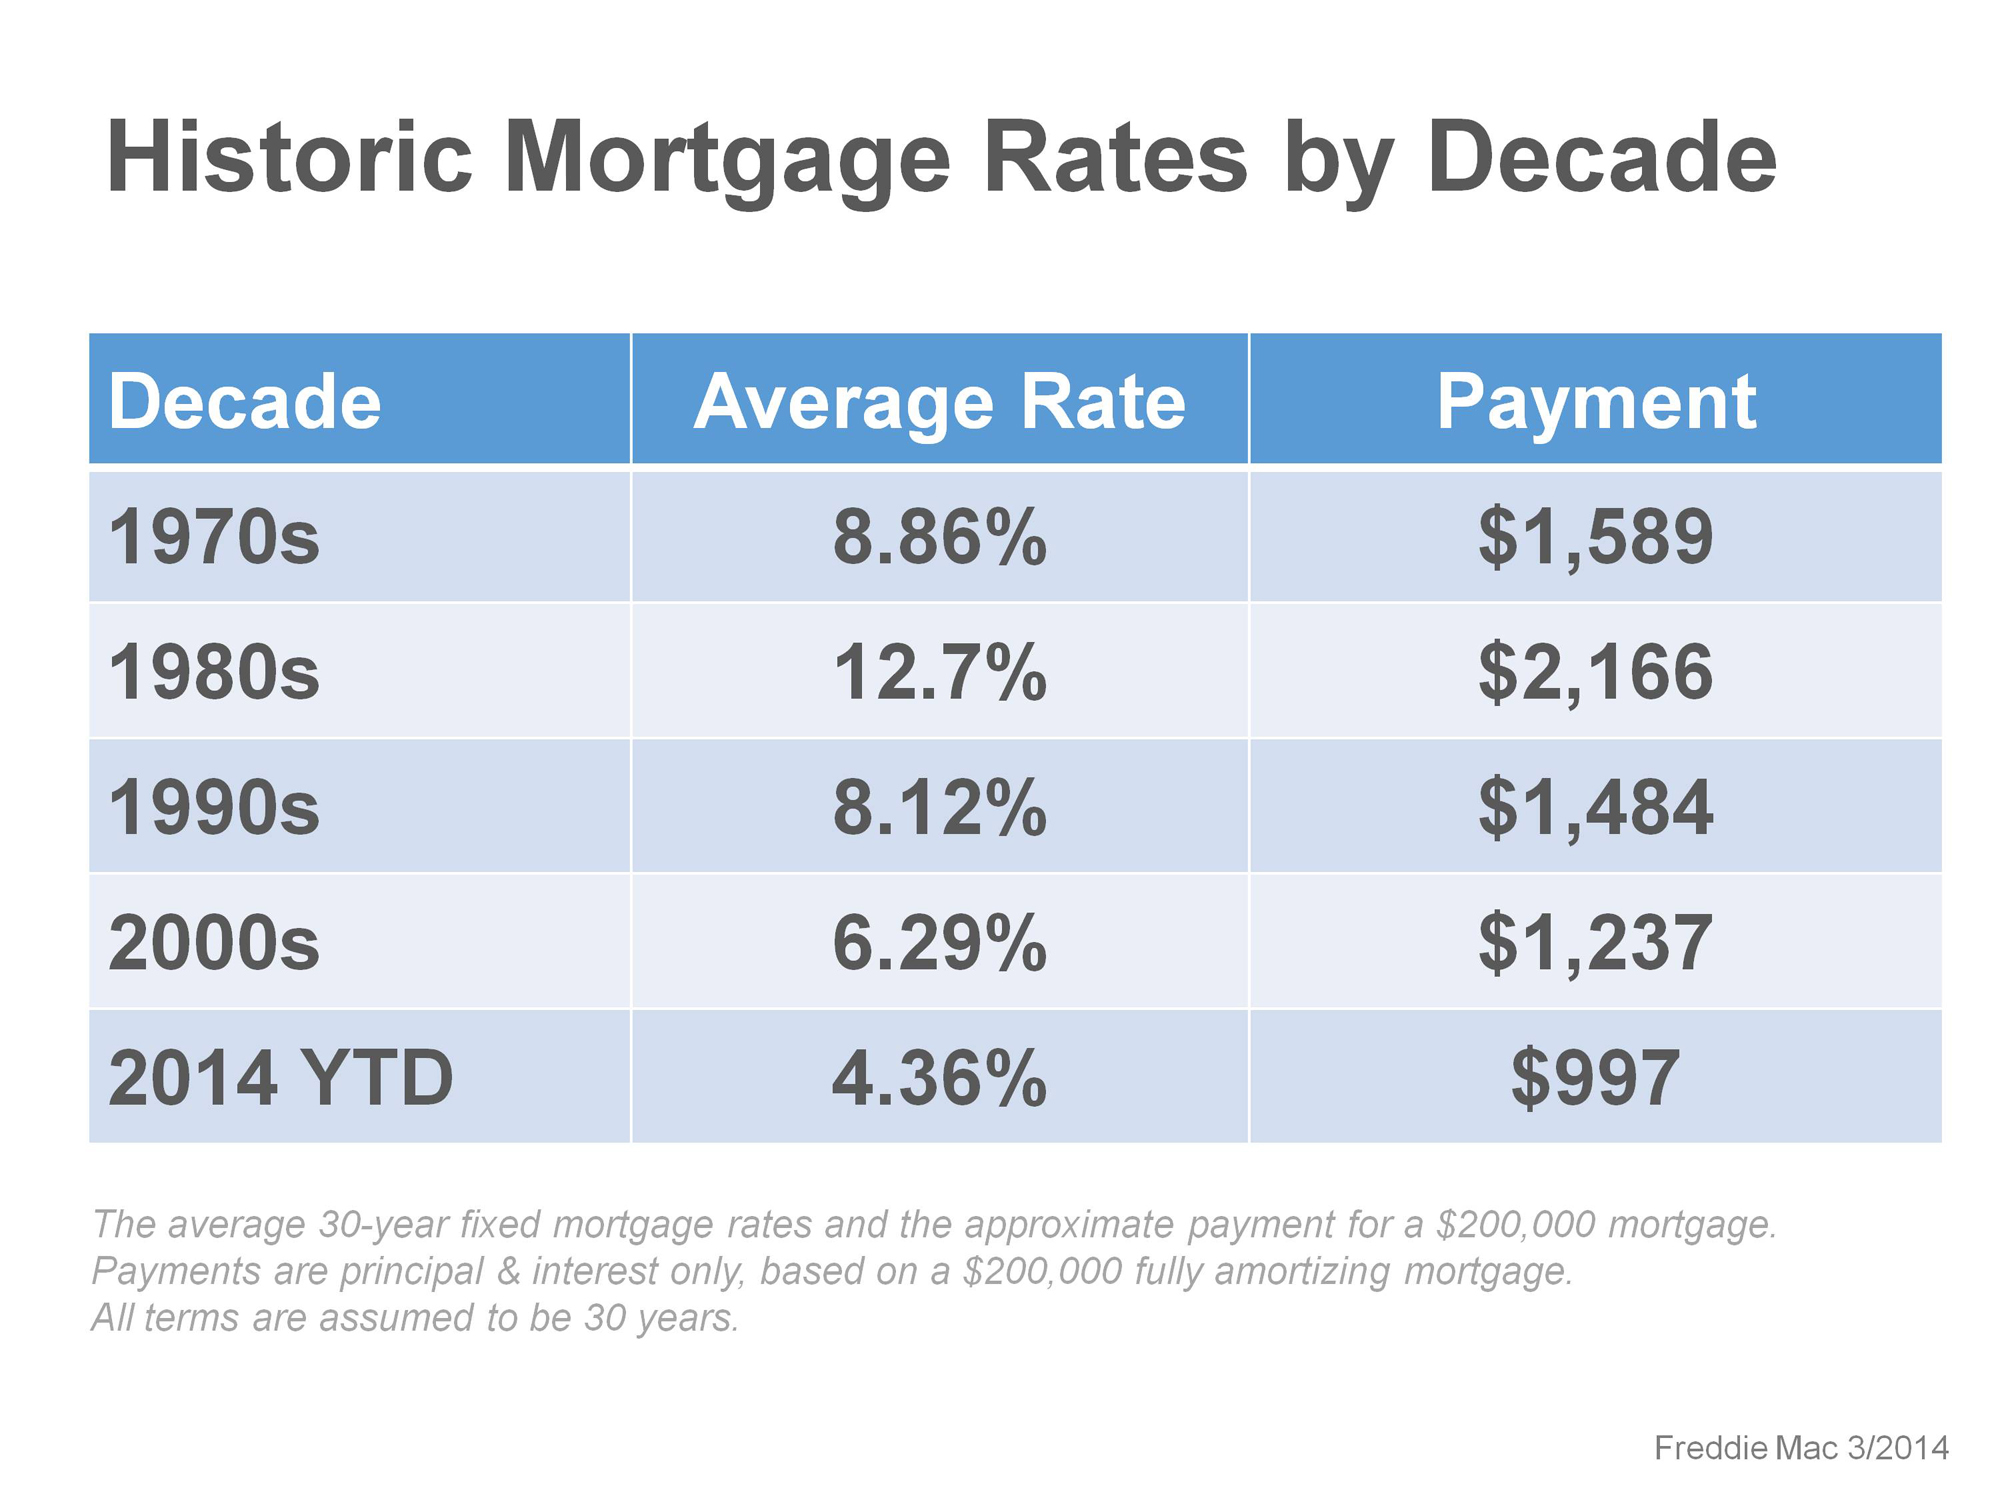
 You've heard it before – "Even a rate in the 5's is great when compared to historical levels" While this is true, I found the chart below helpful in providing perspective. It shows that rates affect the "cost" of housing. Significant shifts in how much a monthly payment costs a homeowner can happen with a swing in rates.
 Possibly the greatest buying opportunity of a generation that was created by the Great Recession will be something we all talk about in the future. How soon that day comes is yet to be determined but it is clear we are still in a great window of opportunity.
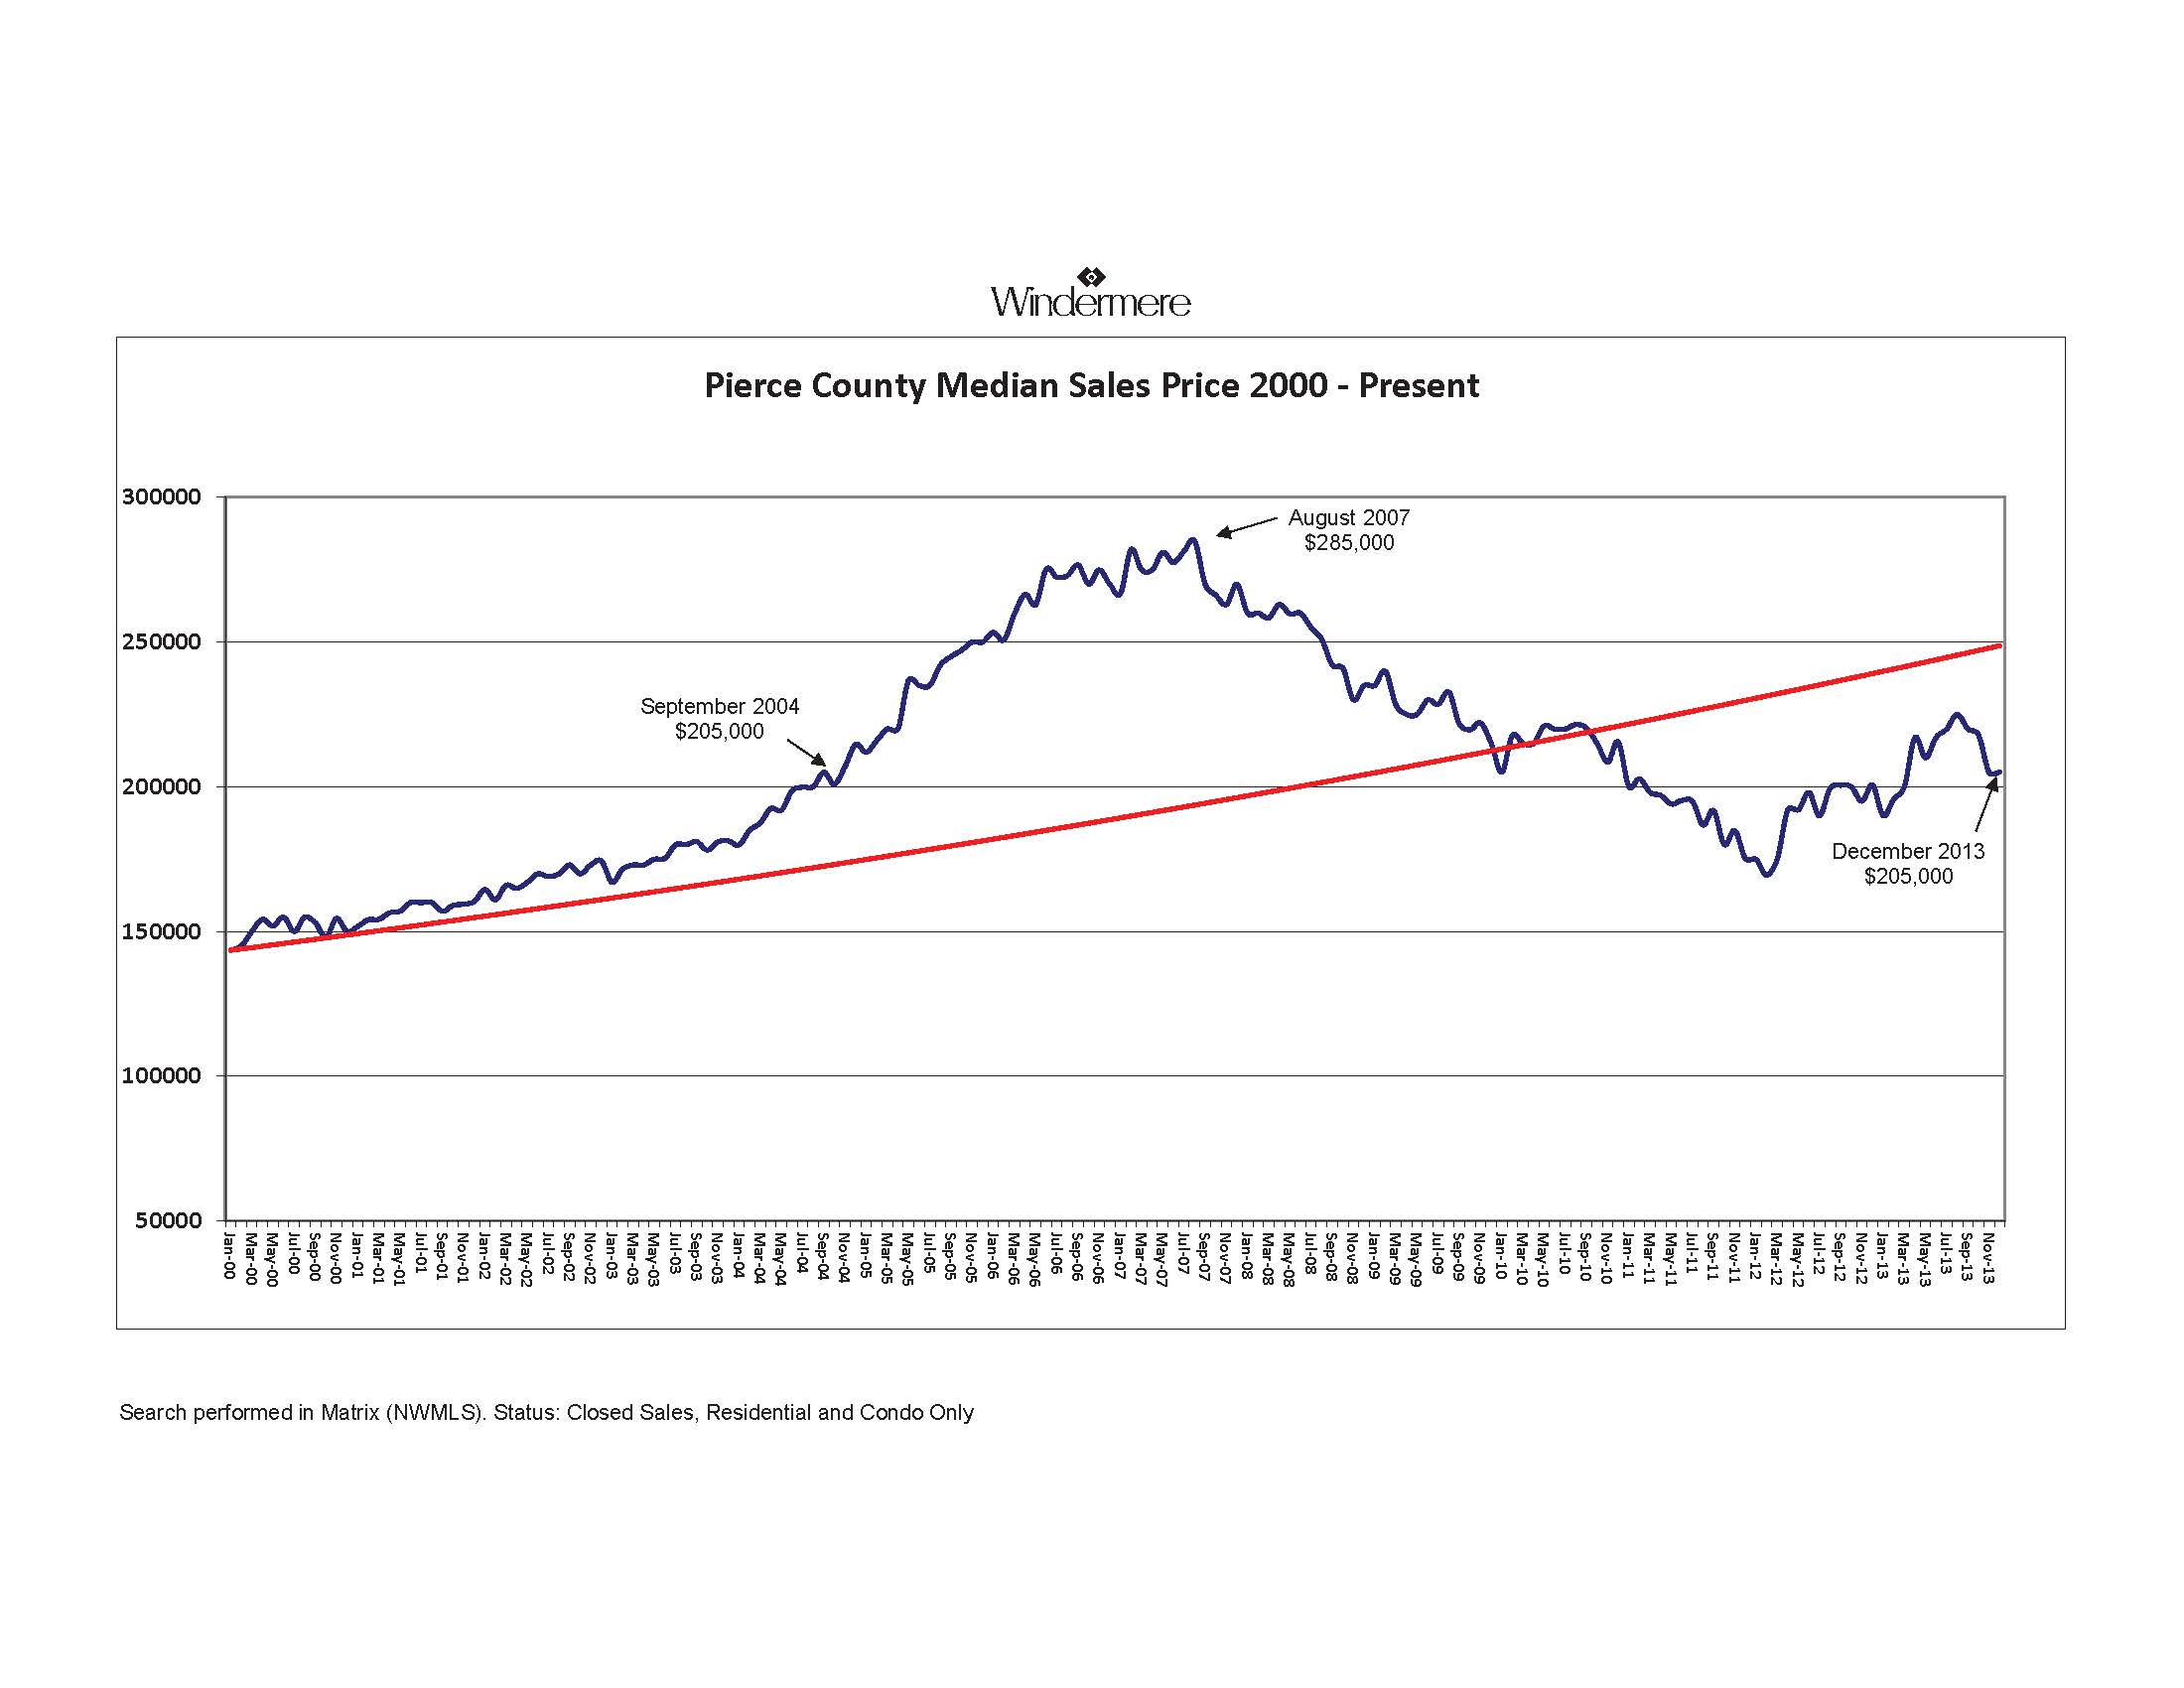
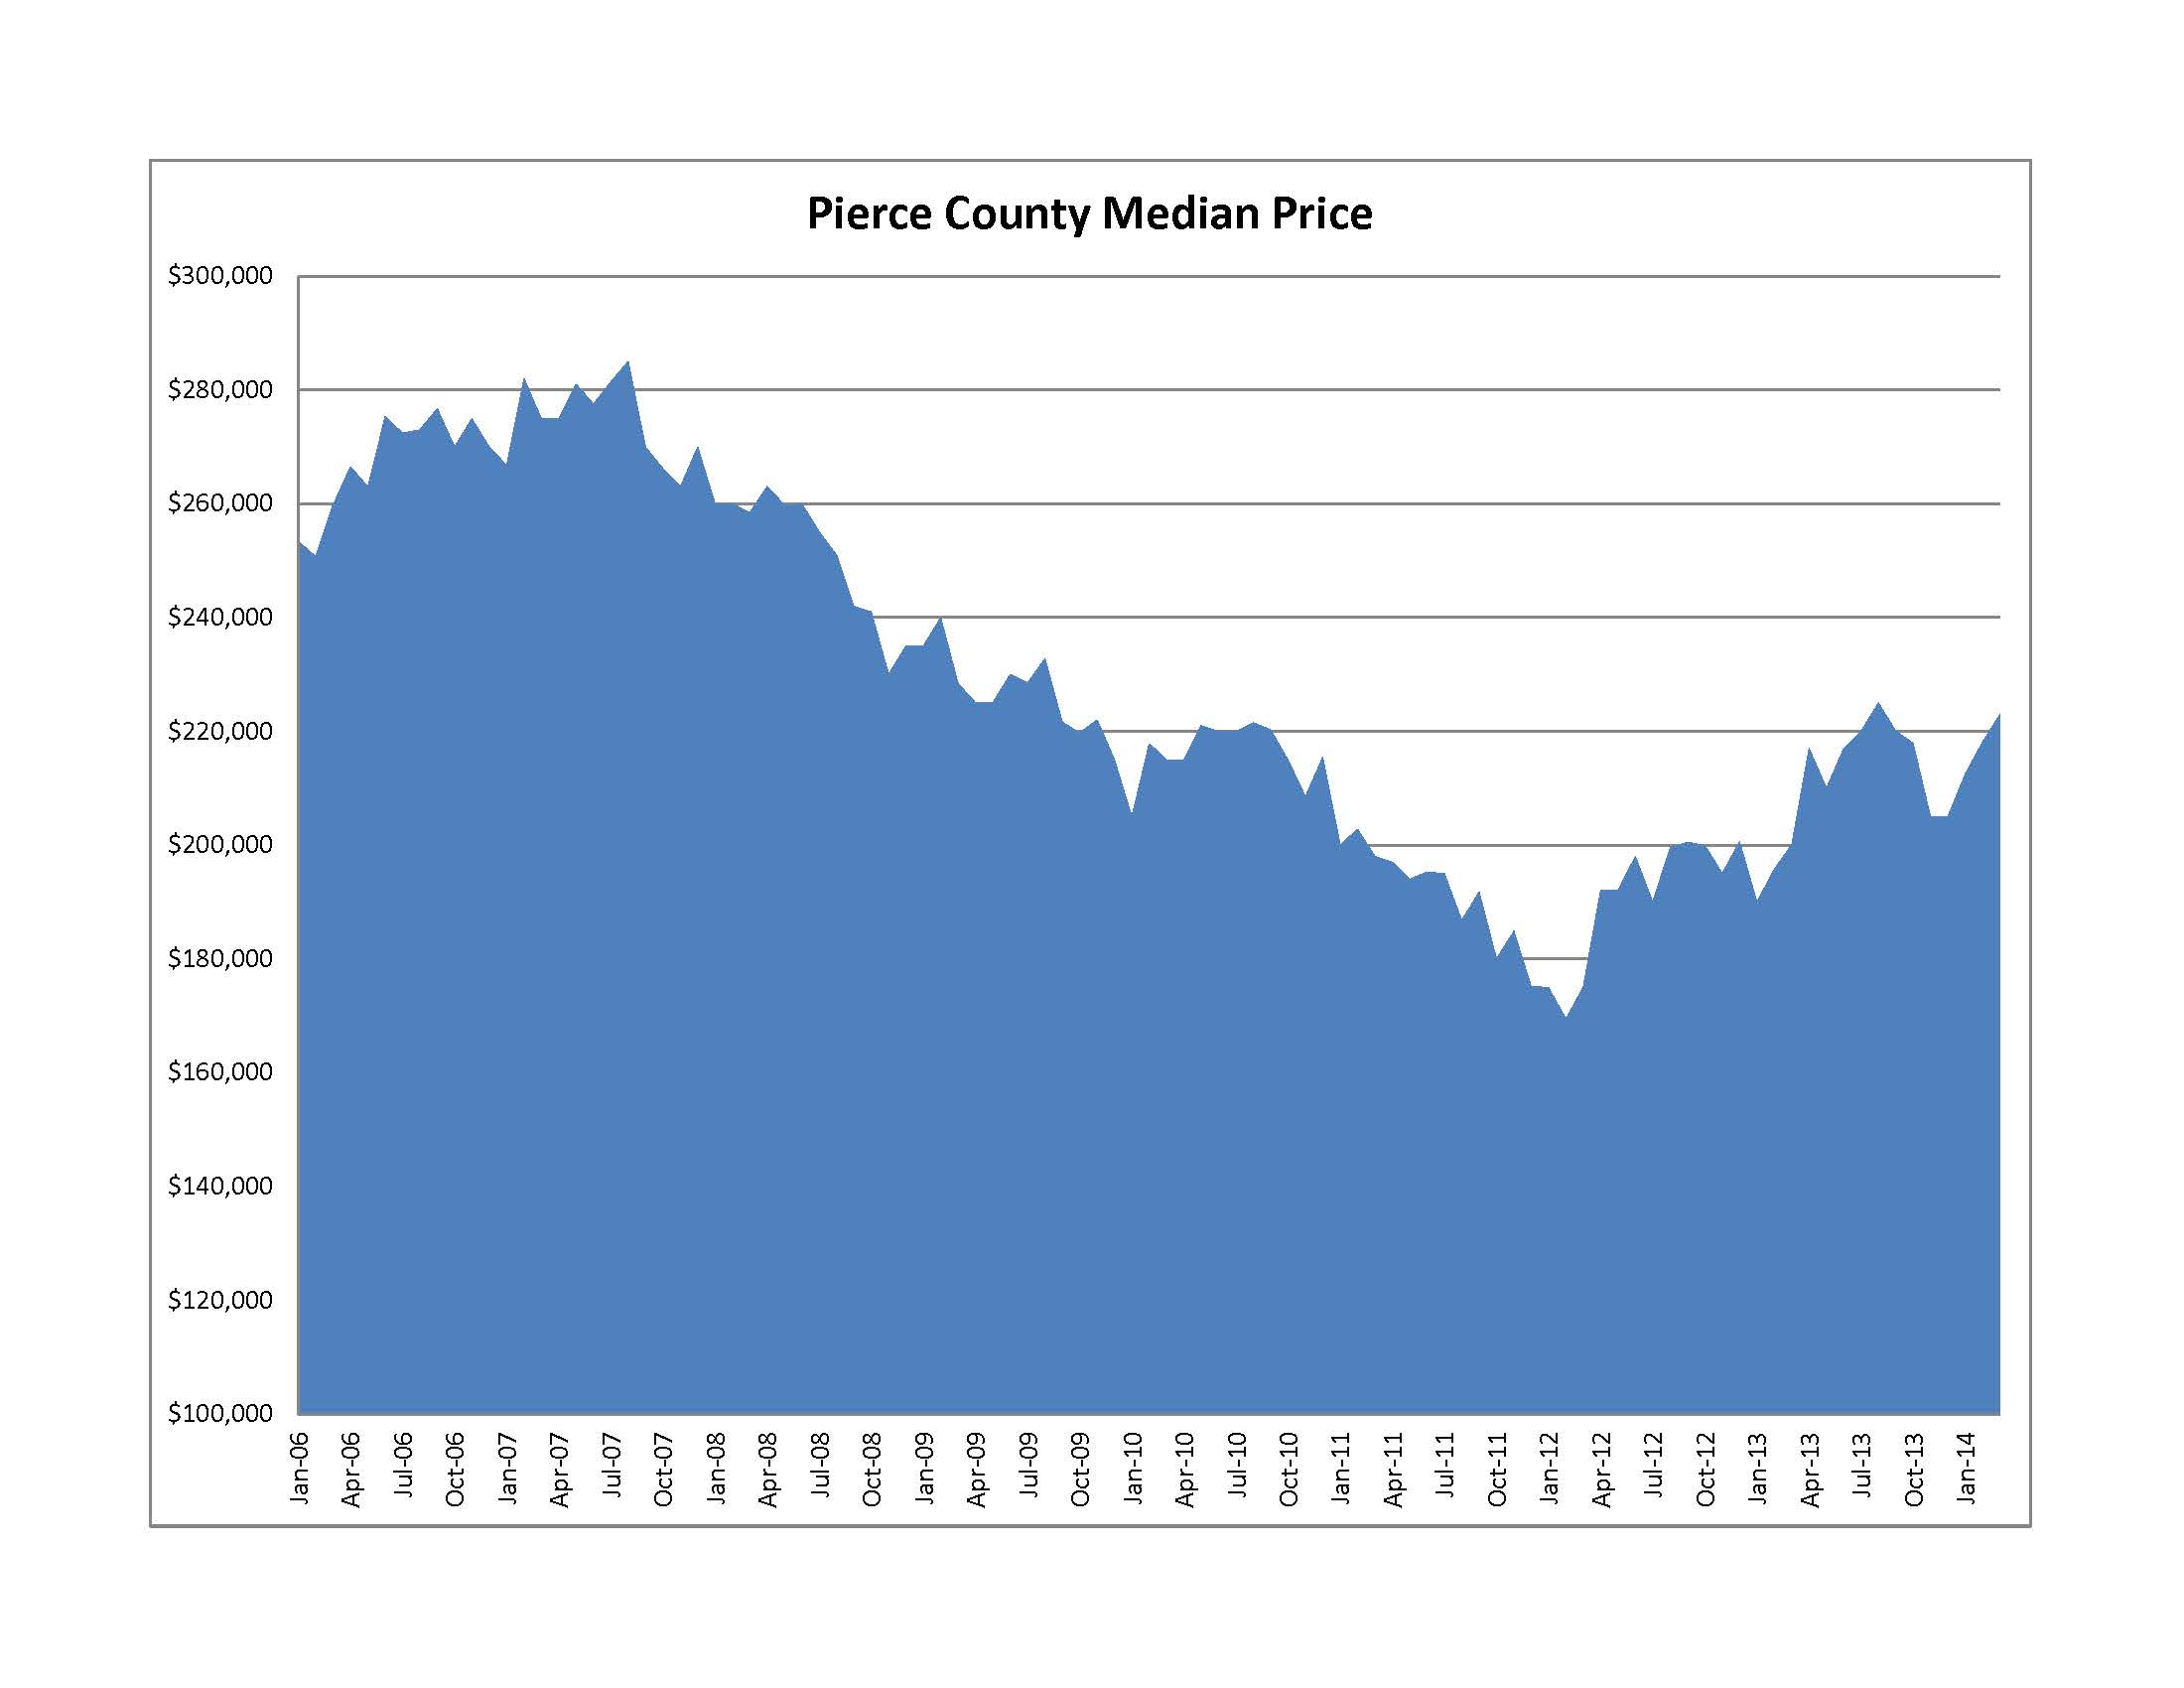 Despite recent gains, Pierce County still remains 21% below the peak median price, couple that with rates in the 4's one can say that both the Price and the Cost of a new home are very attractive!
February 2014 Pierce County Housing Report
Market shows willingness to "get hot"
How do we measure how "hot" a market is? Answer; Sales Ratios.
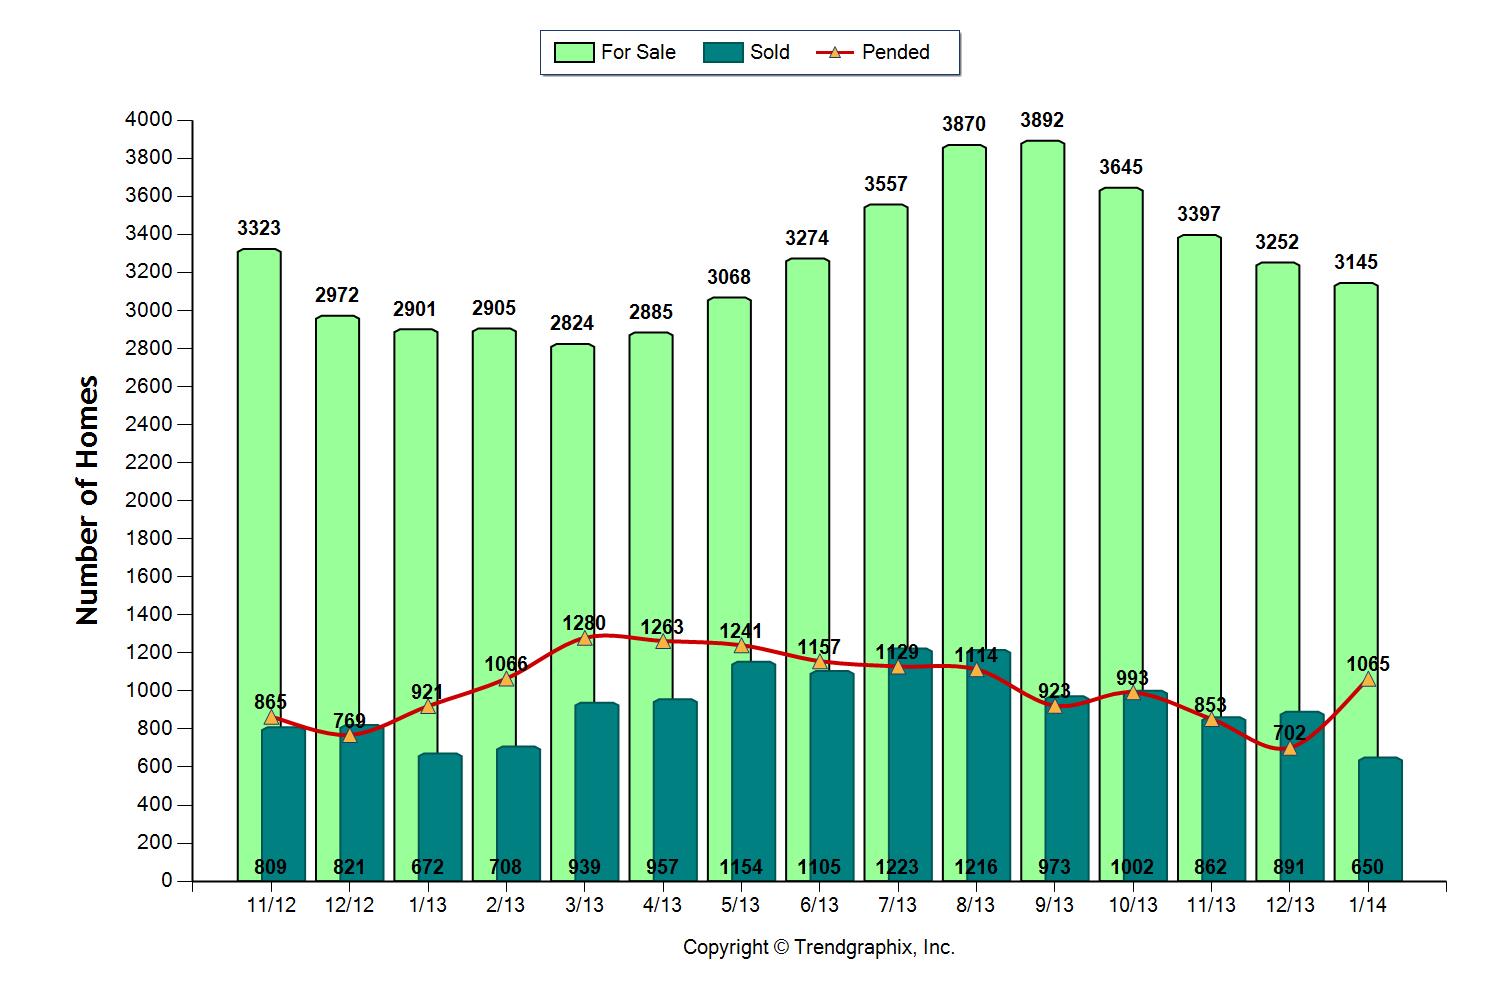
With a big jump in the amount of year over year Pendings we see demand building for what will likely be a busy year in the Pierce County Real Estate Market.
Let's take a look at the rest of the Year over Year numbers
Inventory – UP 8%
Closings – DN 3%
Months of Inventory – UP 4.8
Median Price – UP 12%
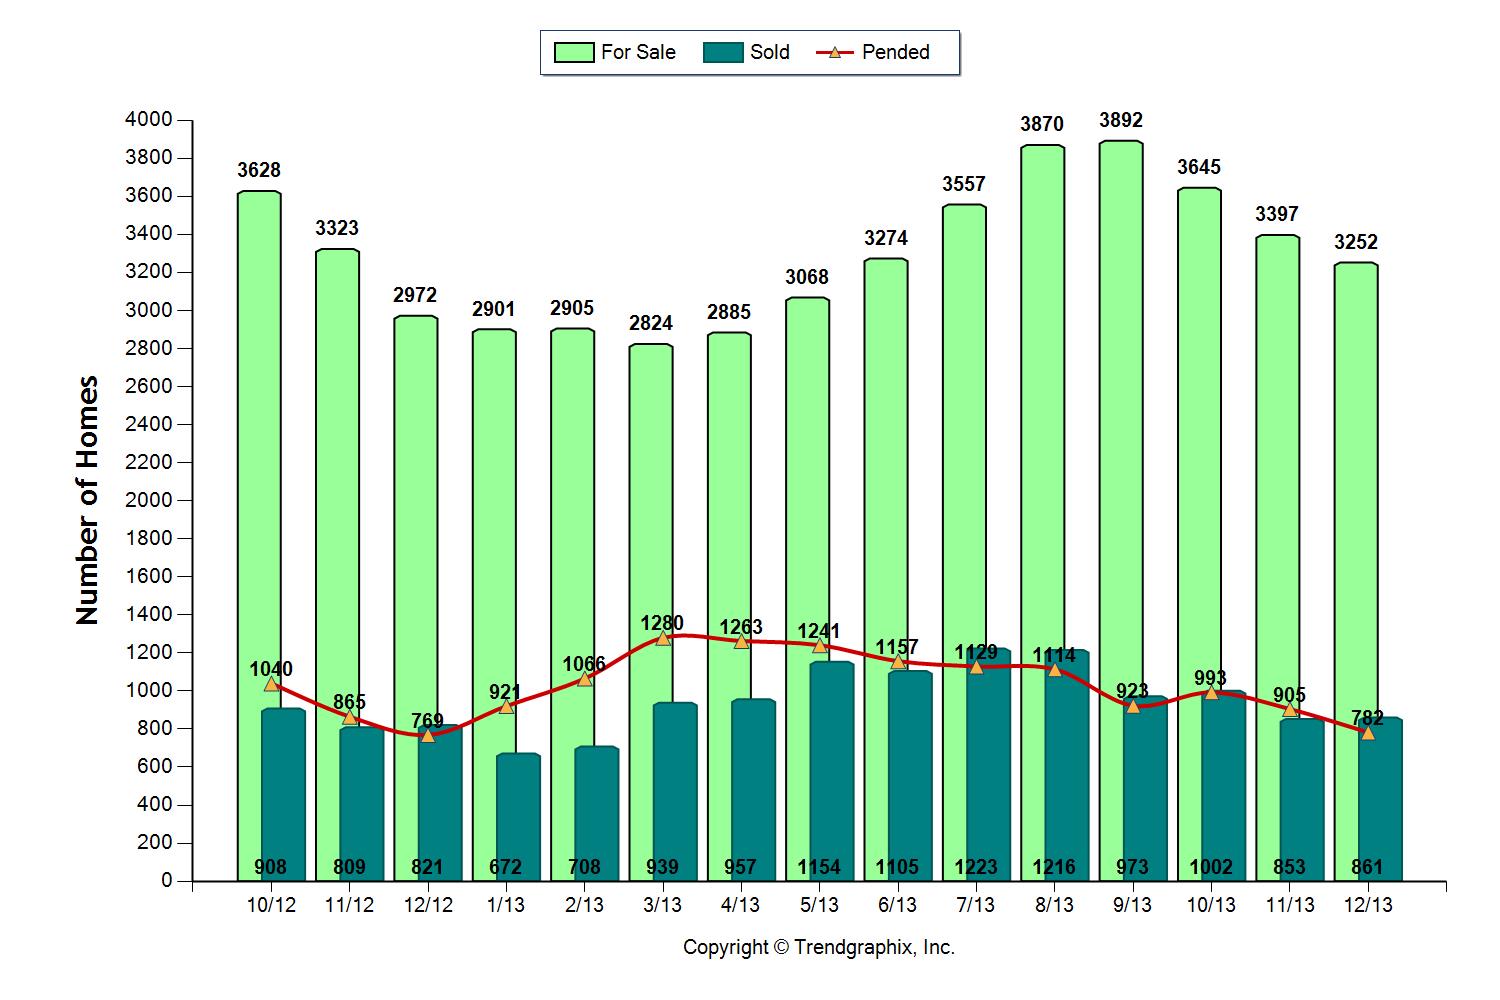
What stands out to me is a jump in Pendings compared to last year. In February 2013 we had 921 Pending properties, this year we have 1,065 for a 16% increase! As the Feds taper their purchasing of mortgage backed securities interest rates are set to rise in the coming months. Buyers are signaling that they recognize this and are moving to make their purchase while they can still get their loan at a discount.
The key for this momentum to build in 2014 will be inventory. As the demand increases we will see Sales Ratios increase which will put upward pressure on prices unless it is balanced with a somewhat equal increase in the supply of homes for sale. Without new and additional inventory, high sales ratios will force multiple offer situations with buyers competing for the best houses.
What are Sales Ratios? Using Sales Ratios to measure the strength or weakness of a market is the most effective way to accurately illustrate to a buyer, or a seller, what to expect. Simply put, a Sales Ratio is akin to absorption rate. It measures how quickly or slowly the buyers are accepting what the market has to offer. To calculate we need to know two things; 1.) How Many homes are Pending? 2.) How many homes are Active (available)? Now divide the Pending into the Active. If the result of this calculation is about 55% the market is relatively balanced between supply and demand. When the result is greater it indicates a higher demand and the trend is in favor of sellers, conversely when it is lessor it favors the buyers. Our firm regularly tracks this data for 20 sub-markets across Pierce County and uses it to advise clients. As an example, the North Tacoma trend graph is below, the Red line is the Pending line and the Blue line is the Active (Supply) line. In this graph we see that on February 11th the North End had 97 Pendings and 138 homes Active for a 70% Sales Ratio. Take a look at last Spring and you can see from March into early June the supply line actually dipped below the Pending line, meaning we had a Sales Ratio over 100%. In that environment Sellers have a clear advantage, the best houses see quick multiple offer situations and prices go up.
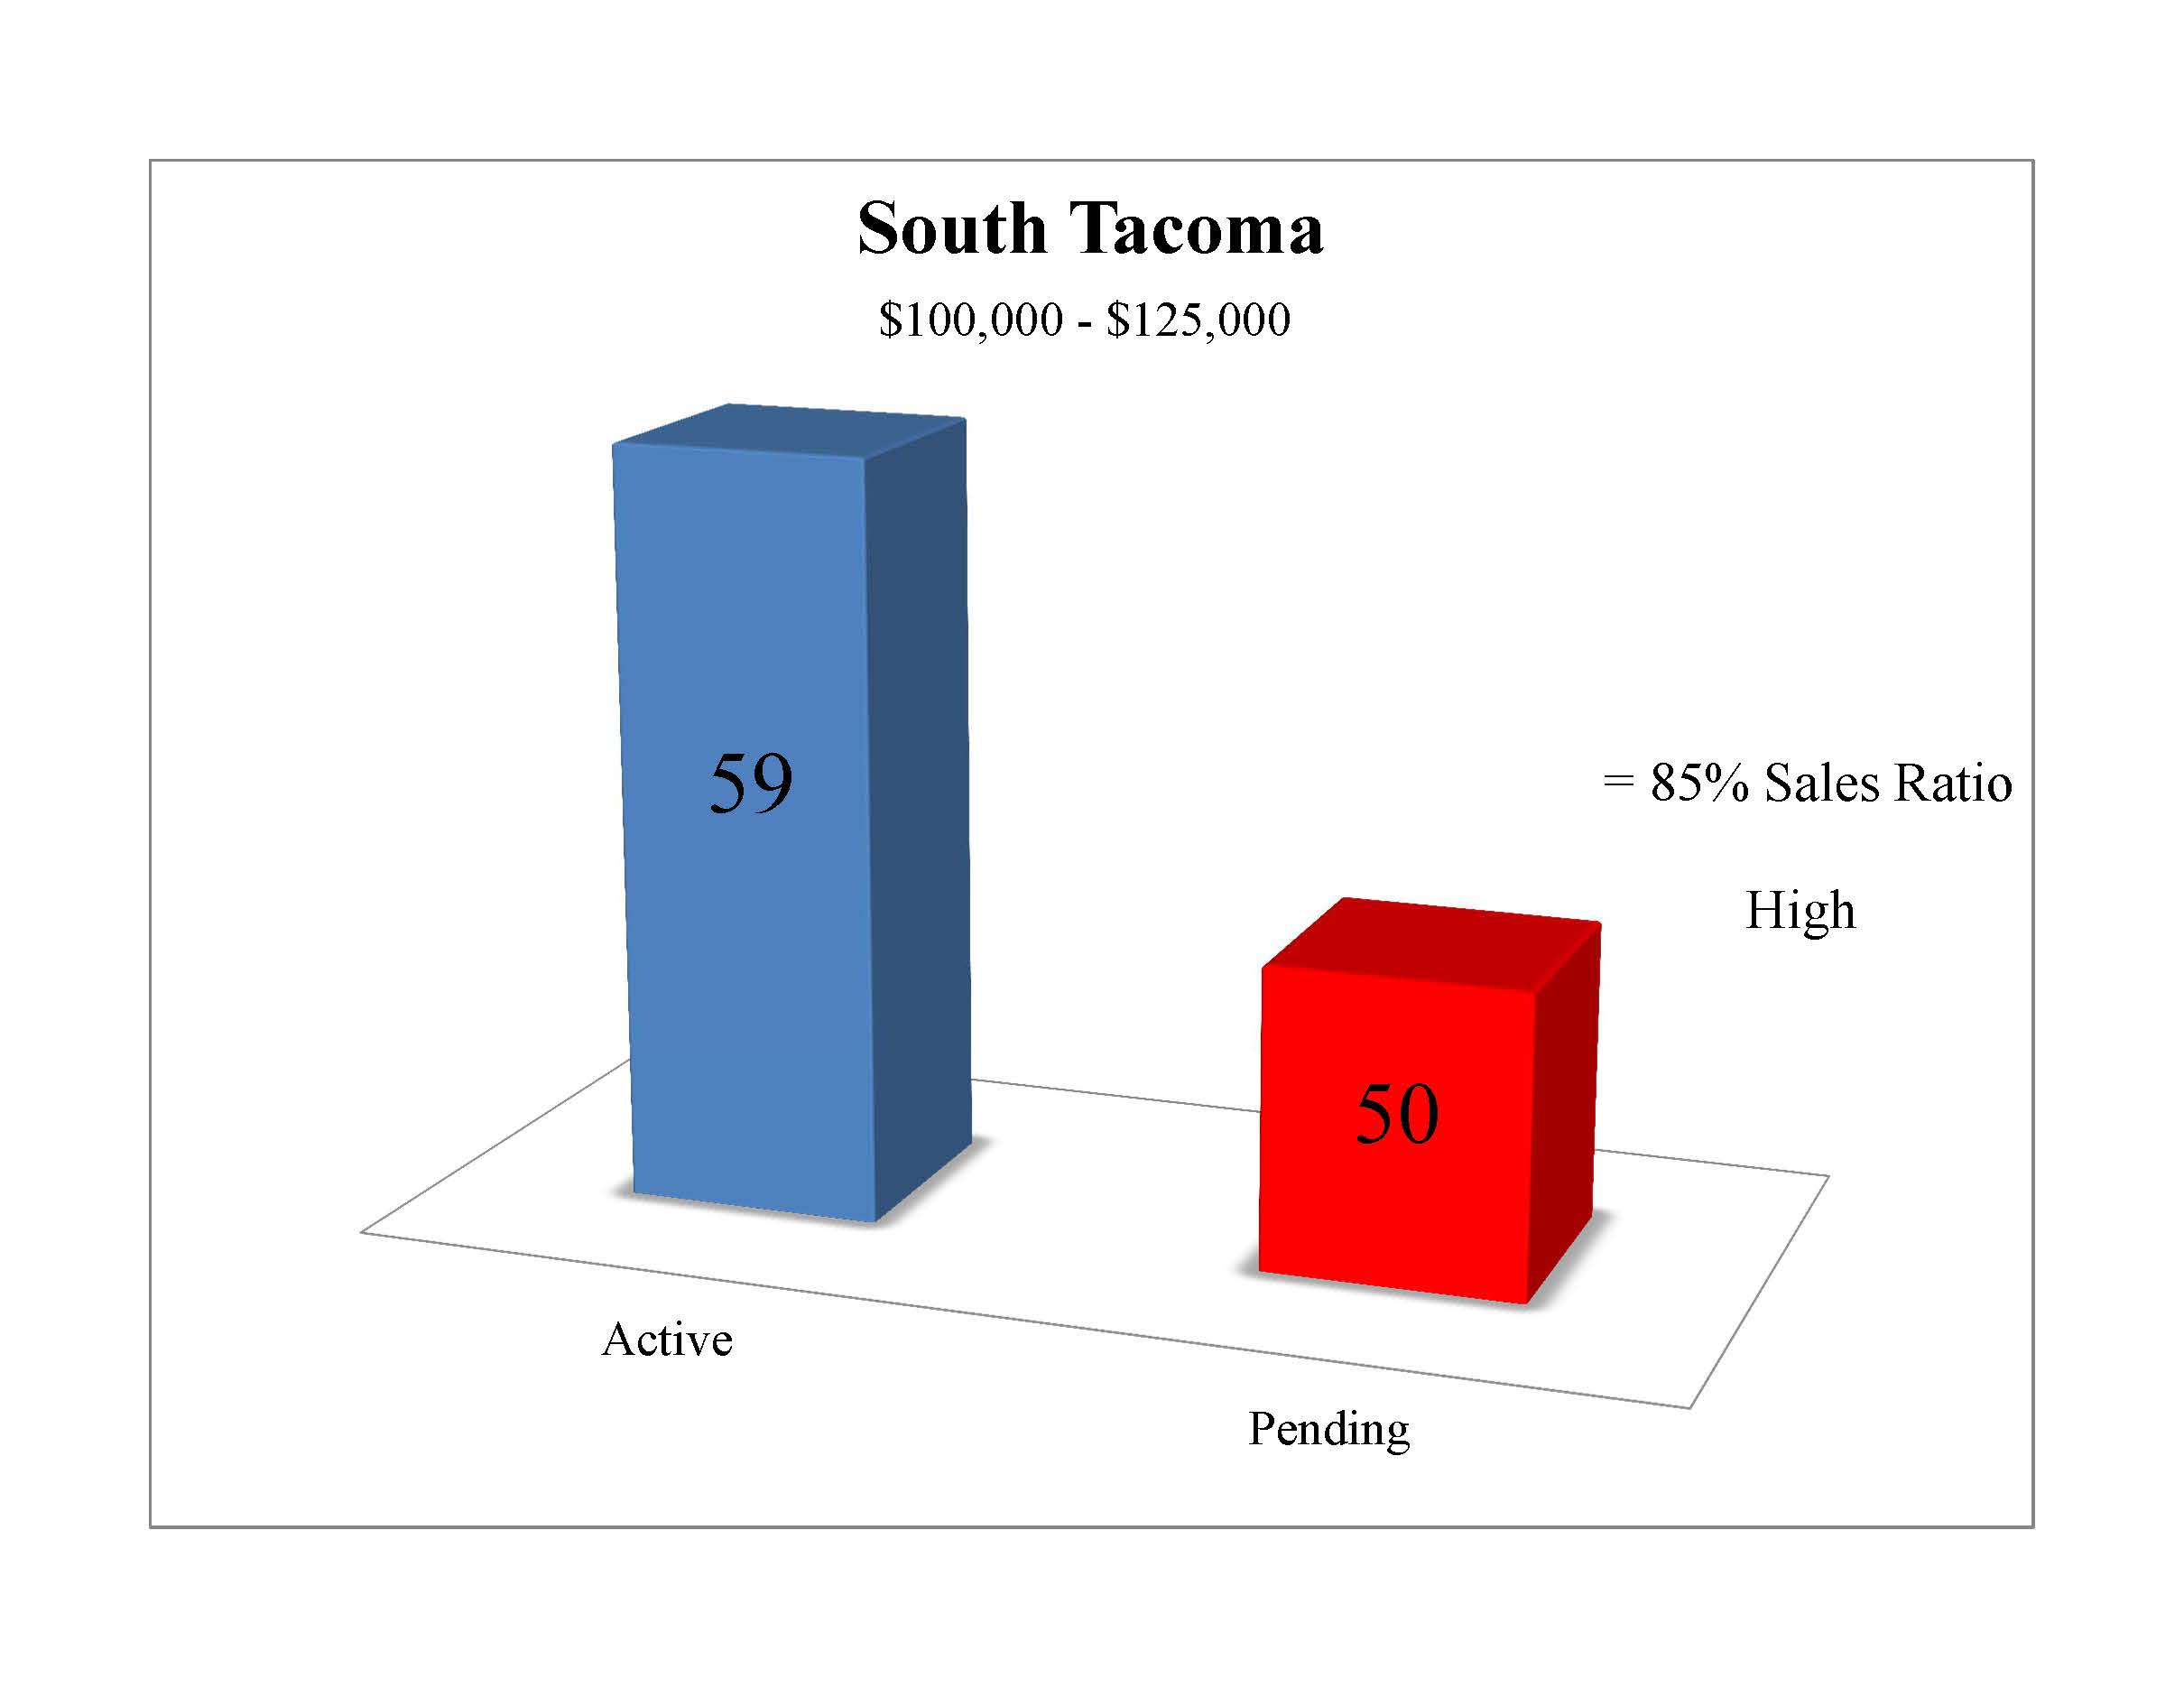
How can you use Sales Ratios to your advantage? The beauty of Sales Ratios is that you can calculate them for any given geographic area and/or price range. It is like your own personal barometer to measure the market strength which is helpful to both buyers and sellers. For some examples take a look at the charts below which have actual numbers at this time. If you are a buyer for a first time or investment property in South Tacoma between $100,000 and $125,000 you should be prepared to compete for a good property. With a Sales Ratio of 85% there are nearly as many Pending properties as there are available homes. Conversely if you are a seller in the same segment you can look at the comps and maybe "round up" a bit when deciding on your pricing strategy.
Neutral Market Conditions are indicated in Gig Harbor between $300,000 and $400,000 with a 58% Sales Ratio. This type of Sales Ratio gives us a balanced "breathe through your nose" kind of market, giving buyers and sellers the luxury of some time when making their decisions because neither demand nor supply is dominant.
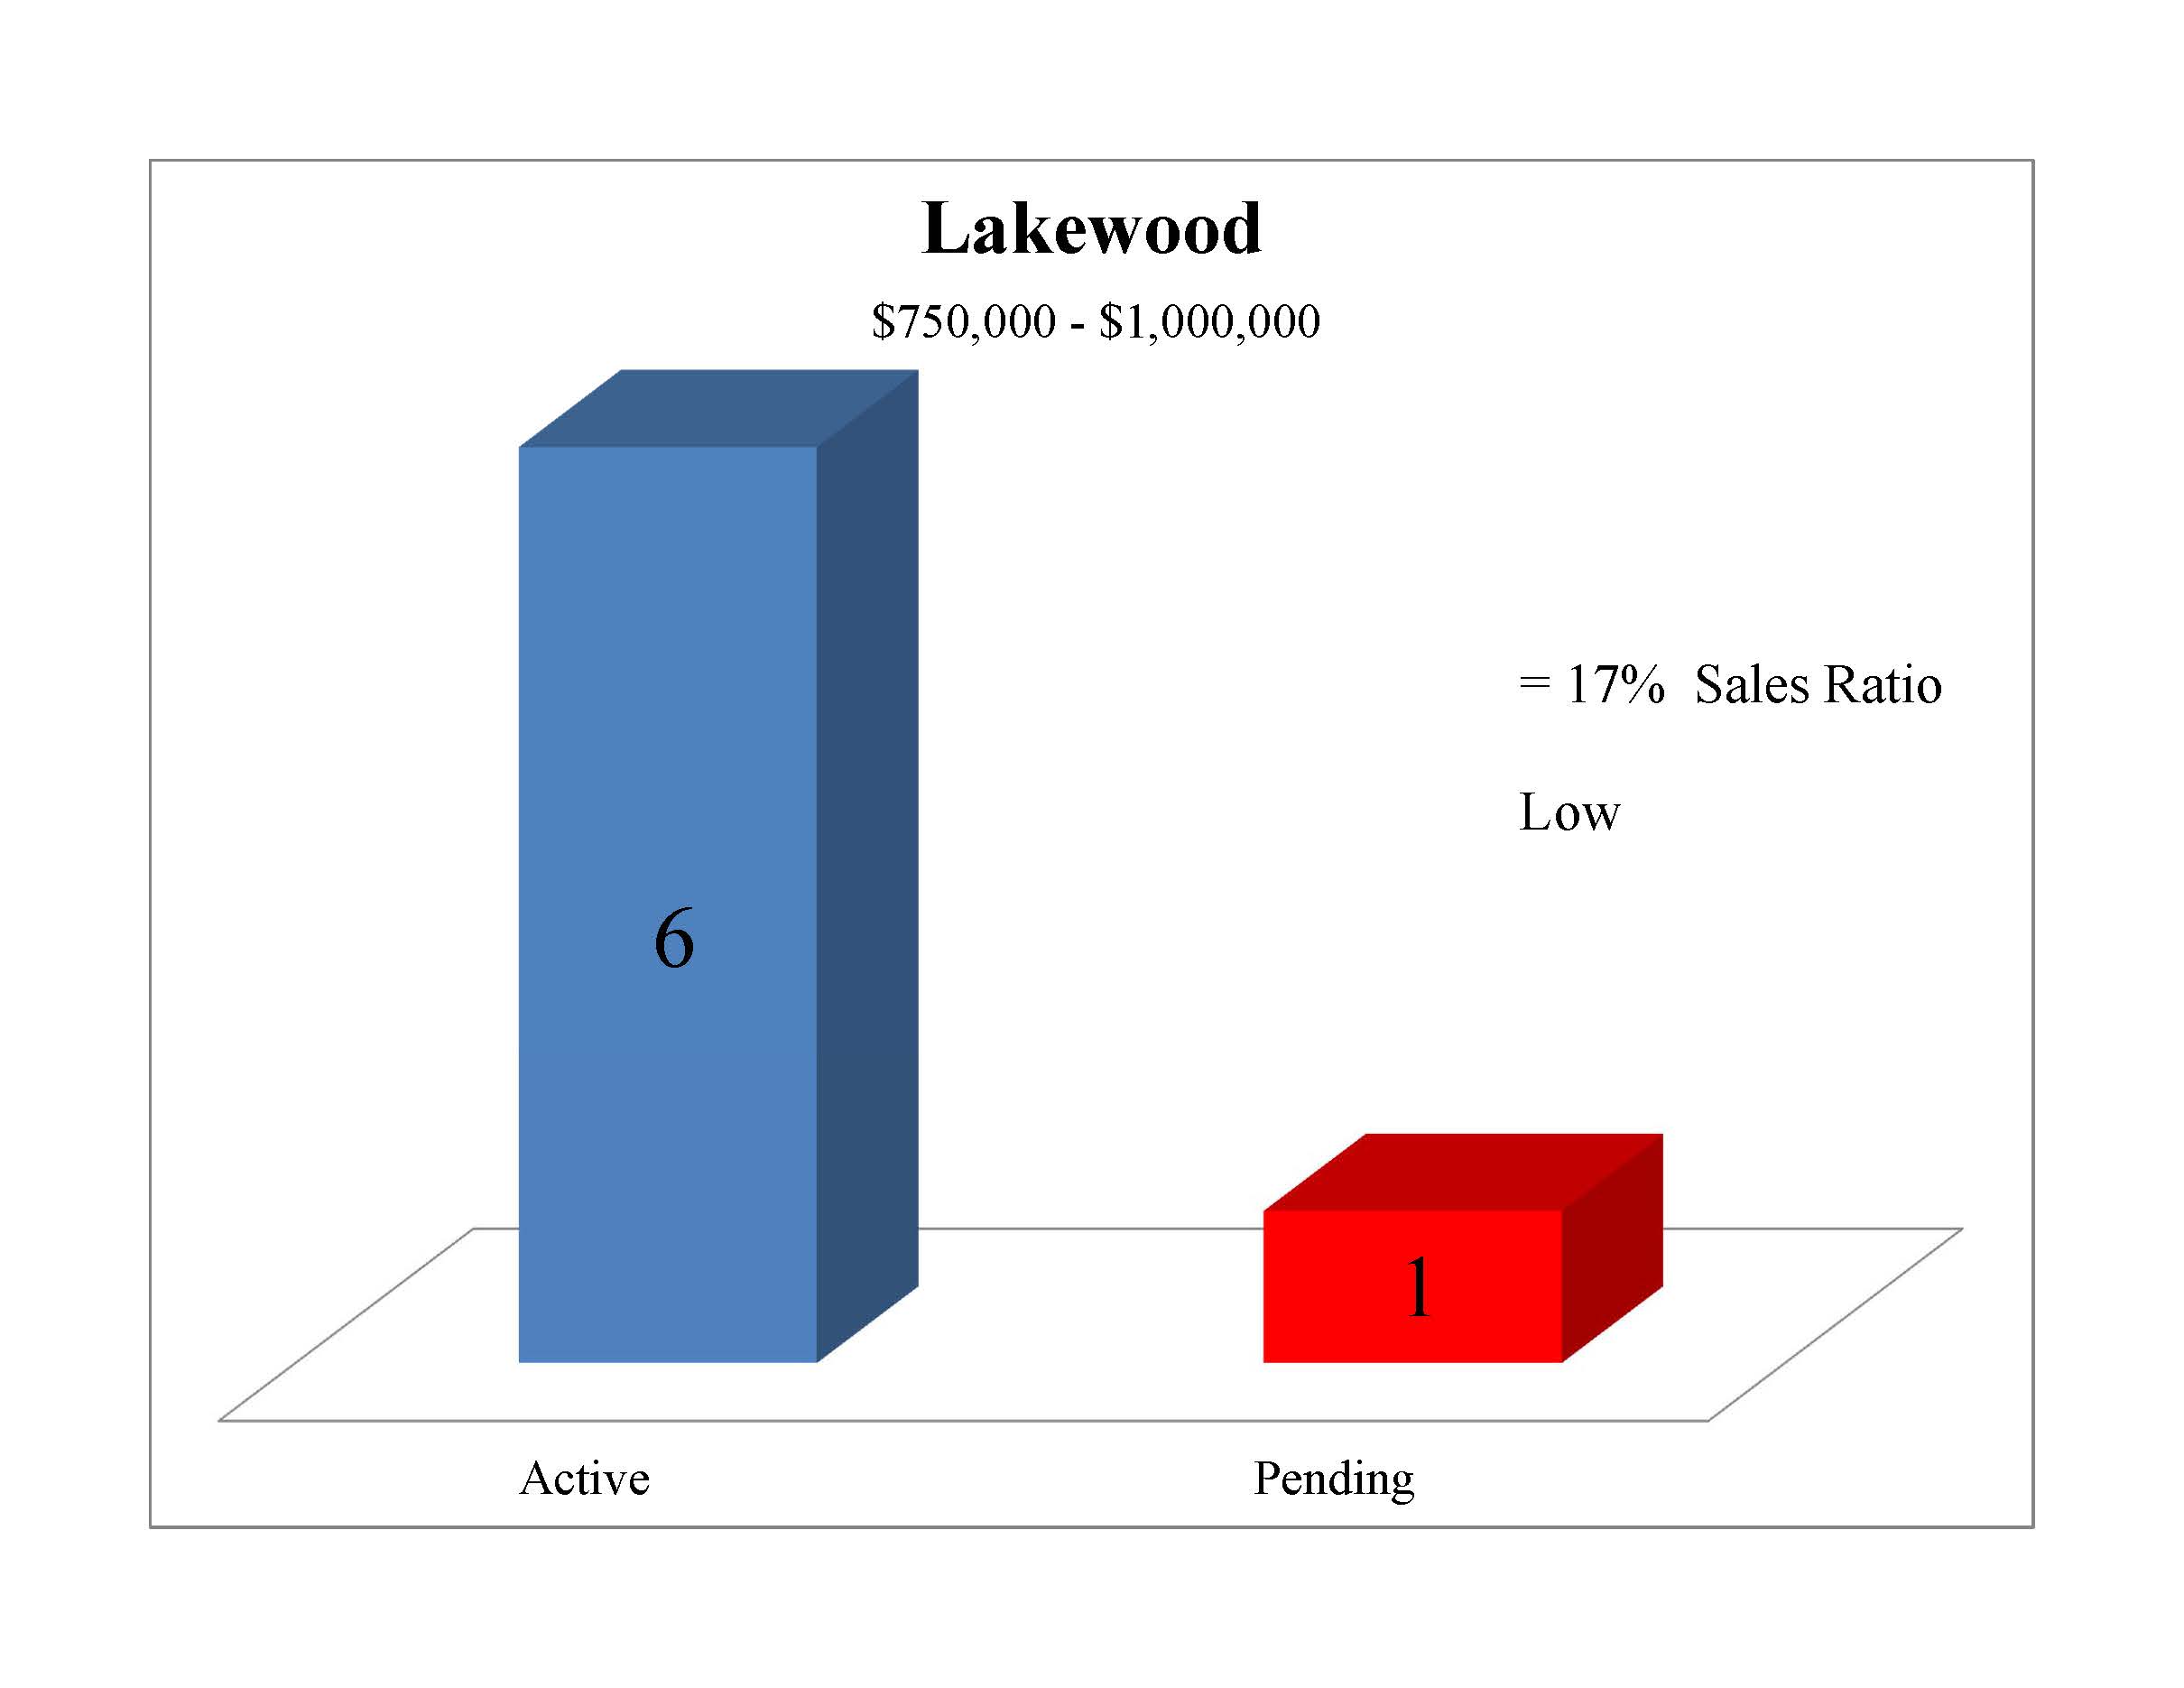
Low Sales Ratio of 17% exists currently in Lakewood in the upper end price range of $750,00 – $1,000,000. Buyers experience less competition allowing them the time to see all inventory, make a decision and possibly a lower offer in this type of market while sellers need to realistic about their home, condition and pricing.
So the next time you are curious and find yourself wondering, "How's the market?" Ask your broker what the Sales Ratio is in the market you are wondering about. If you are selling, buying or just keeping tabs, the answer will give you a much more accurate picture of just how things are. Whether the answer is high, low or neutral will tell you what kind of market you're stepping into and sets you up with a head start against the competition.
Let me know if you have any questions on this report. It's always good to hear from you!
January 2014 Pierce County Housing Report
A Phenomenal Year for Real Estate is Underway!
The Market Recovery of 2012 was followed by Market Stabilization in 2013. Now it's time for Growth in 2014!
A look into what is driving our market in a moment, first here are the year over year numbers:
Inventory – UP 11.5%
Closings – UP 5%
Months of Inventory – Even last year 3.6 this year 3.8
Median Price – UP 2.2%
For several years I've talked about a steady recovery and stabilization period for our Pierce County Market while somewhat equal but opposing forces have been pushing and pulling the market. For example, many homeowners have outgrown their home, or their home has become too large with family changes, and they have been unwilling or unable to accept the re-calibrated market price of their home, and therefore not willing to make the move. While they were waiting there has been a steady supply of distressed properties on the market creating drag on prices. This has created a substantial "pent-up" demand that has started to find it's way to market. In some cases move up buyers are recognizing that even if they take a loss on the house they are selling, the bigger house they are buying is also much less and the difference works in their favor. We could all see that before, but few made the move, the difference now is "confidence". So 2014 promises to deliver one the most active, appreciating, and dynamic markets we have seen in years! Here are some reasons why:
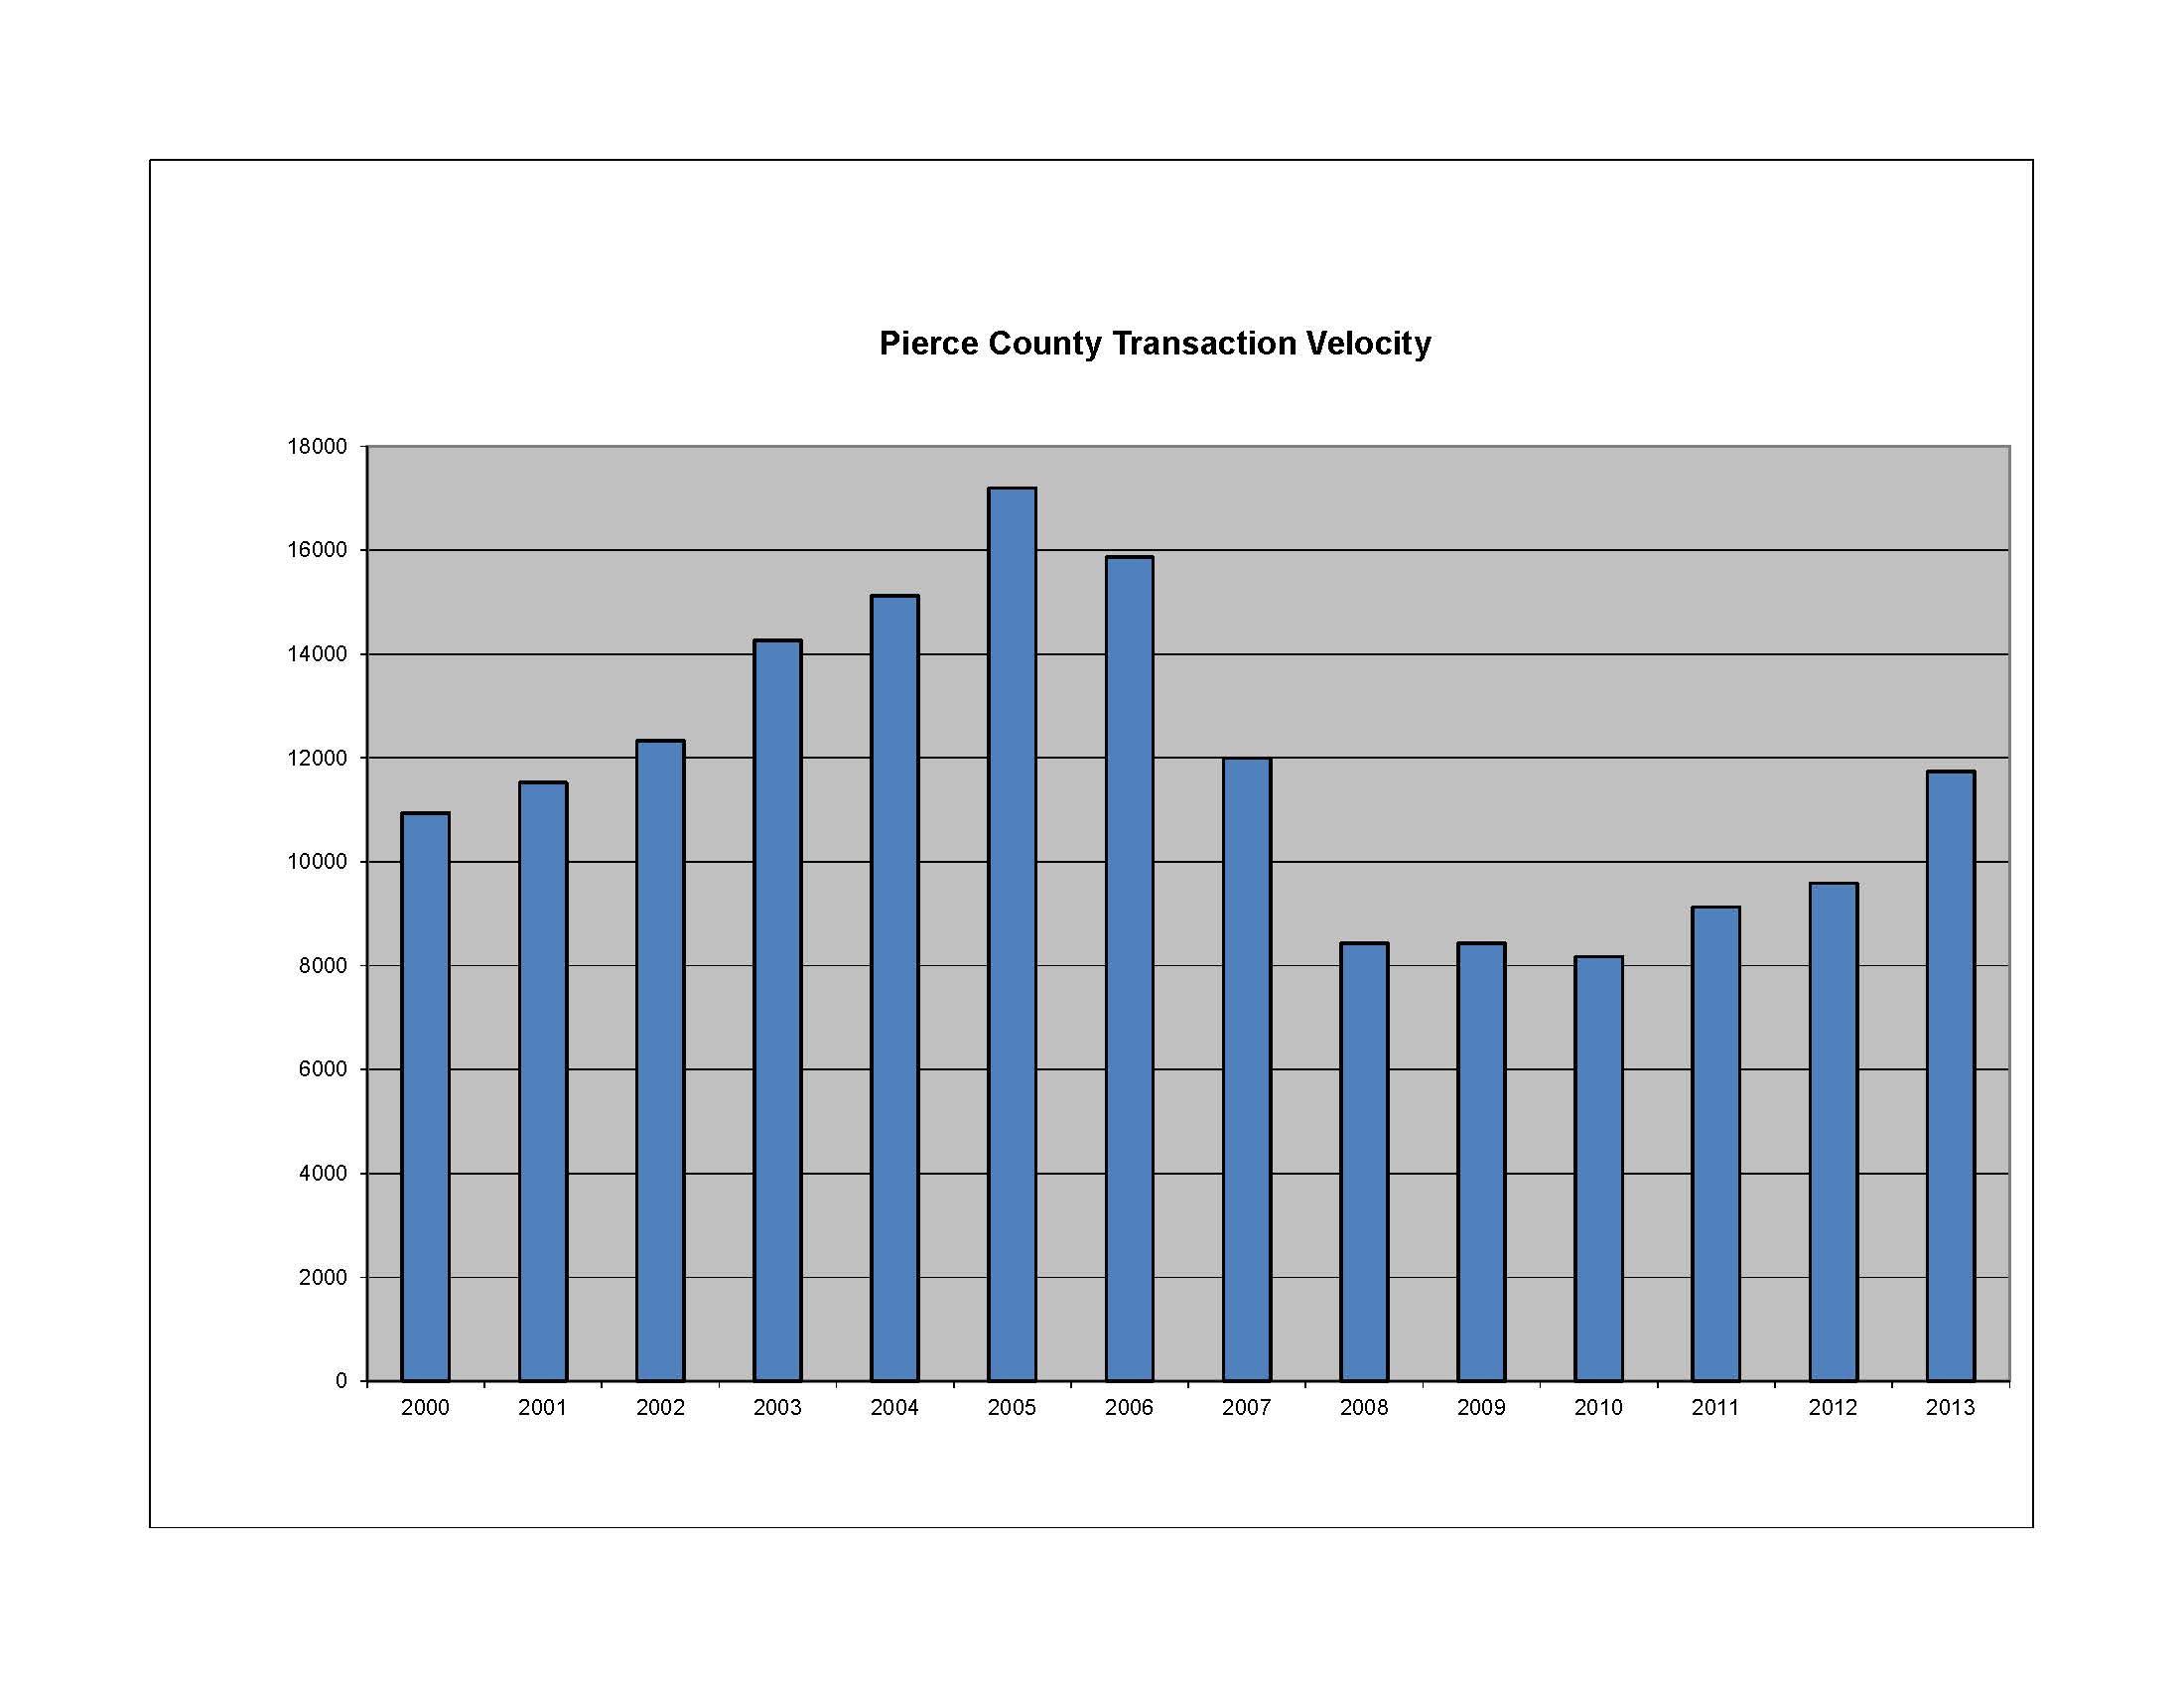
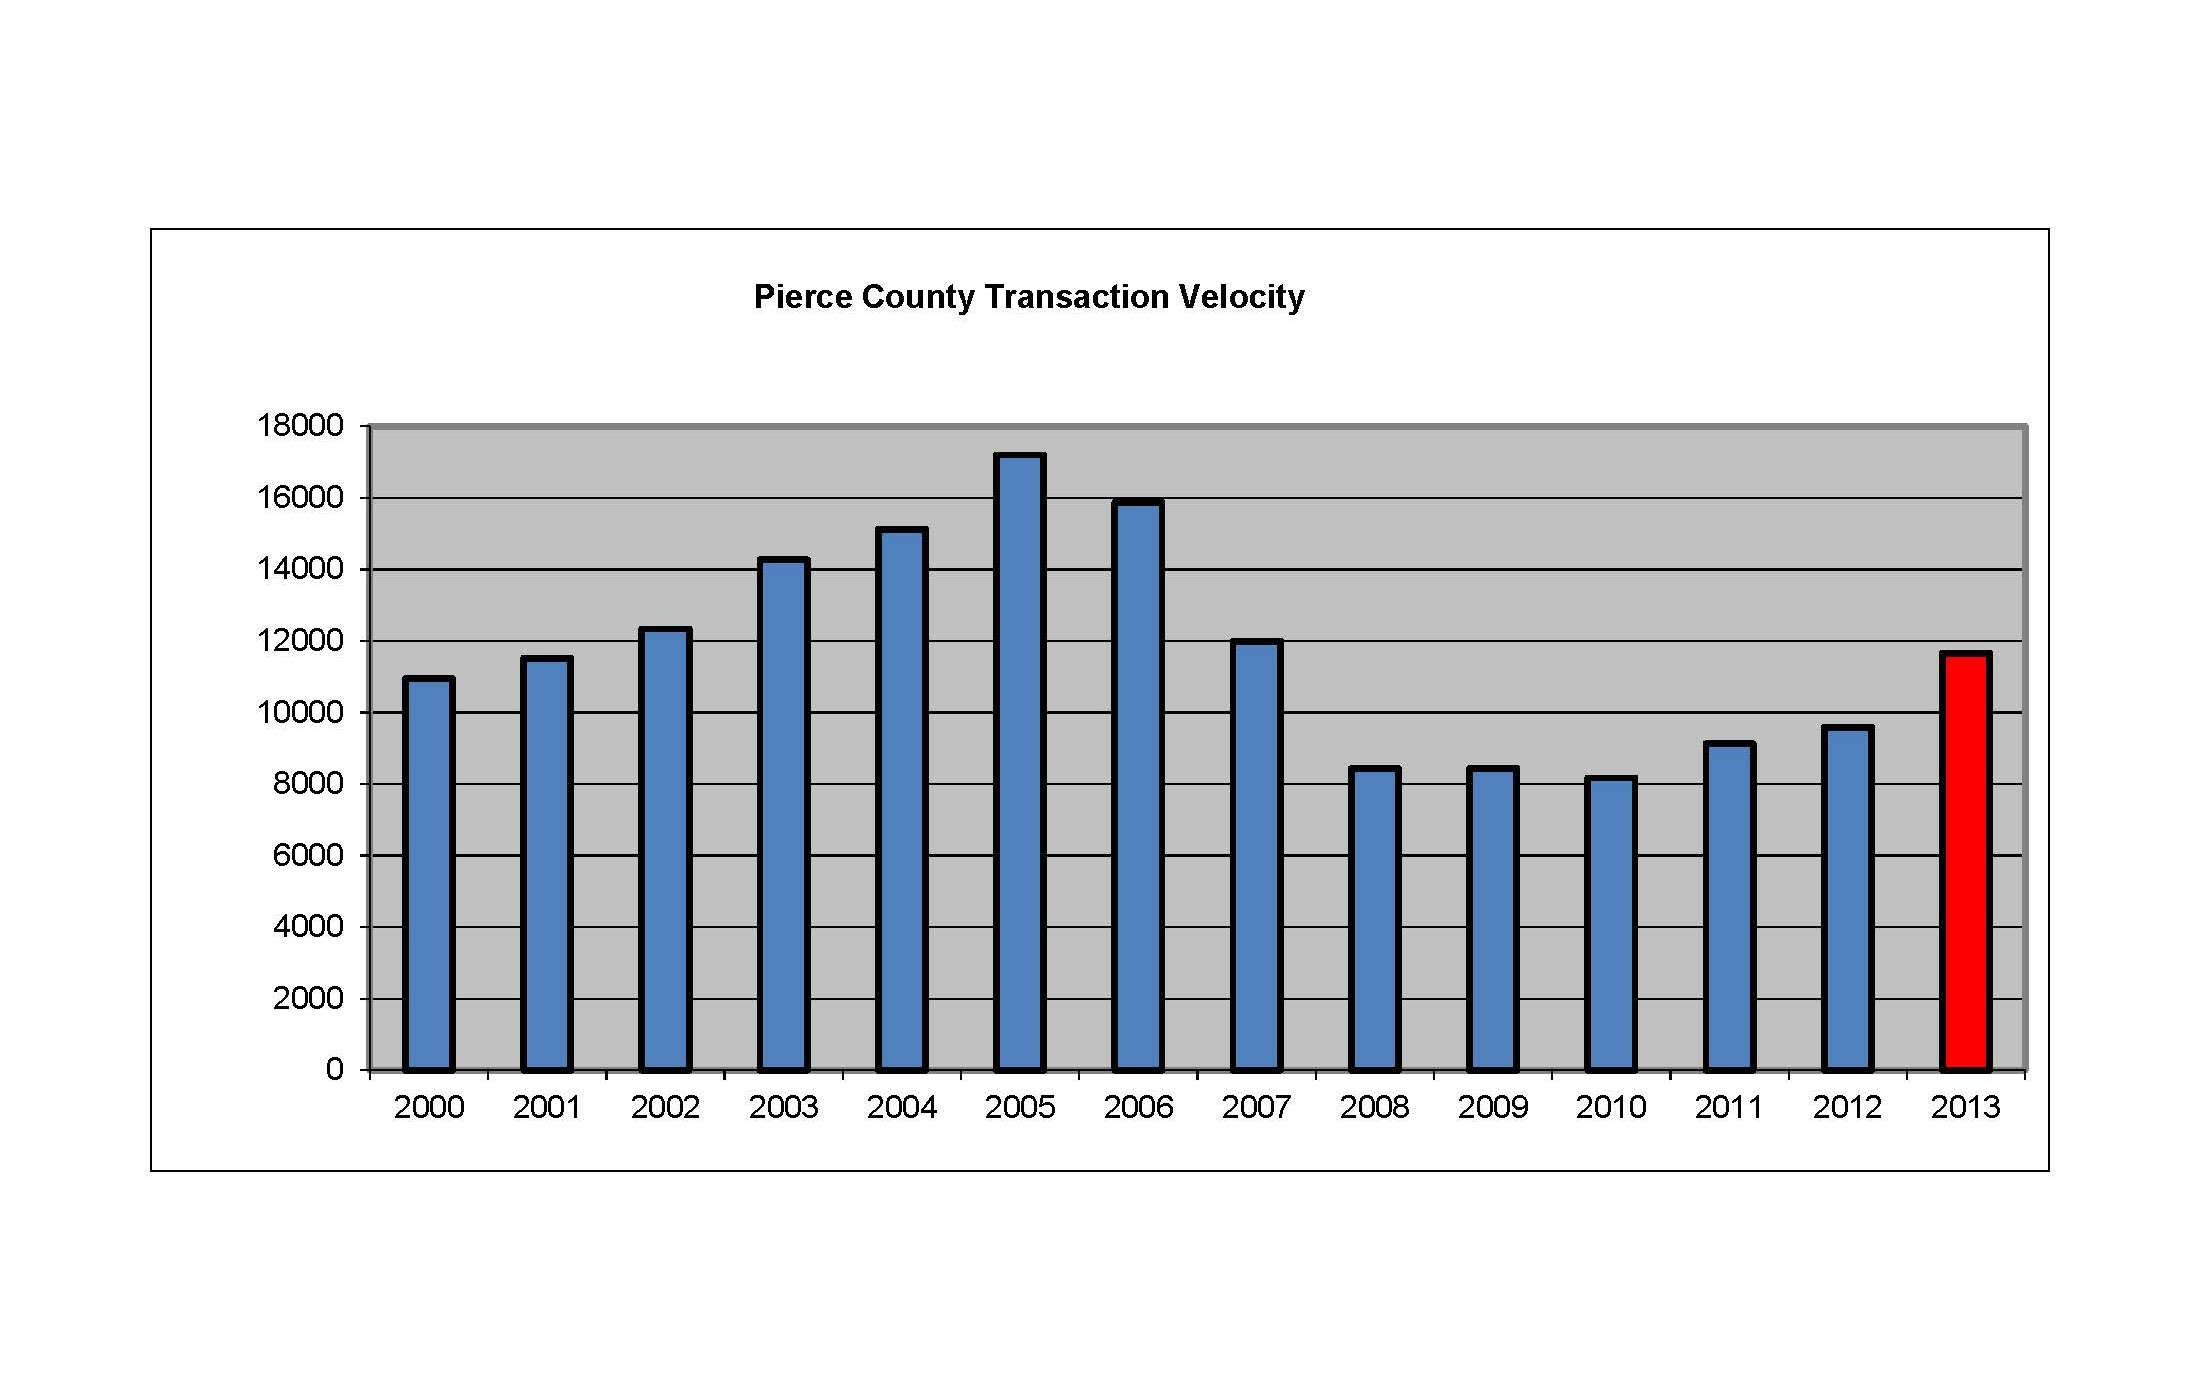
Transaction Velocity is at Normal Levels This is an update from last month now that 2013 numbers are final. For several years I have said that the market recovers in two ways – and one is always before the other. First is Transaction Velocity. The transaction volume (units sold) must come back into line with the traditional norm before we can have a full recovery and further appreciation of prices. Now that 2013 is in the books we know Pierce County transaction velocity was 11,737 units. That compares to a 12 year pre-bubble and post bubble average of 12,749. The chart below illustrates the fluctuations, 2013 volume is 22% greater than 2012 and 92% of the 12 year average! With this increased velocity the Days on Market that it takes a home to sell has gone from 86 days in 2012 to 71 days in 2013.
Prices Will Go Up in 2014 Faster Than 2013 The baseline on transaction velocity makes an indisputable case that demand for Pierce County Real Estate is back, for the most part thanks to 1st time buyers and investors. In 2014 the young 1st time buyers will increase their interest in home ownership but there will be an additional demand from existing homeowners moving up – moving down – moving out and so on! In 2013 the median closed price went up 7.9% from January to December. With every percentage point of appreciation a new group of homeowners are finding themselves "above water" on their mortgages and able to make the move they have been waiting for. As more of this positive equity is unlocked it will release a new contingent of buyers on the market. Pierce County is still 28% off of the peak median price we saw in August of 2007 but I think we are at a tipping point of demand and supply that will cause that gap to narrow more than any of the last 5 years. Markets seek equilibrium and chart below shows us Pierce County has been over-corrected and below the average appreciation line for a long time.
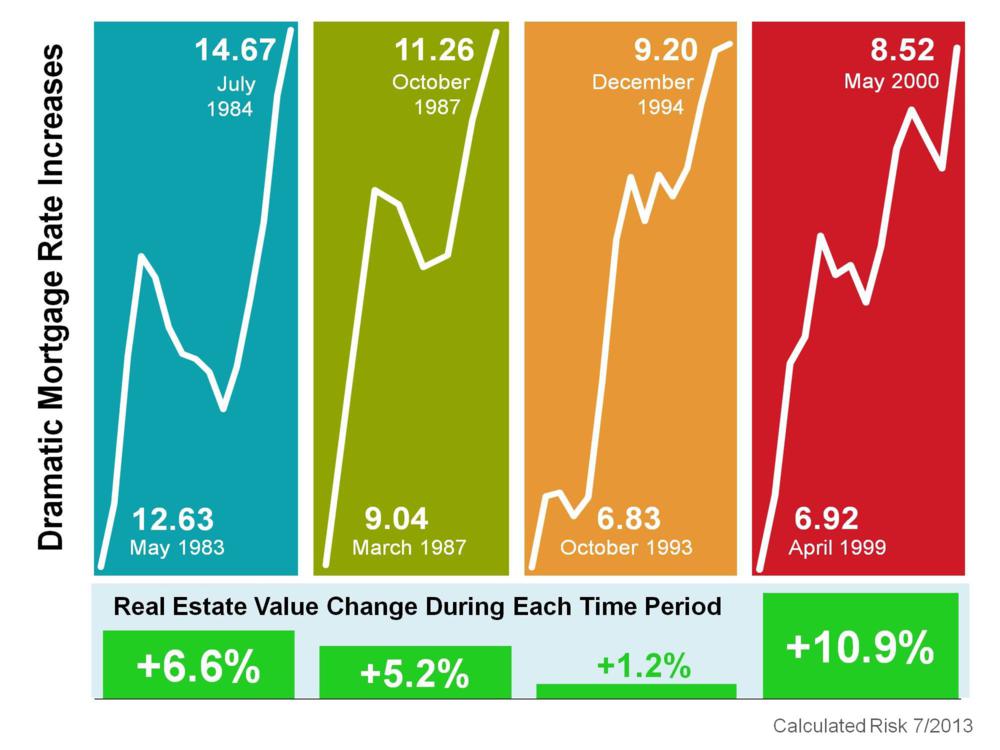
But What About the Fed and Interest Rates? For the last few months I have discussed the Federal Reserve tapering their robust purchasing of mortgage backed securities and the effect that will have on interest rates. Increases in mortgage rates cause the cost of housing to increase because most home purchasers obtain a mortgage loan when they buy. It has been predicted by some that as the Fed tapers (we know they will) and mortgage interest rates go up (we know they will) the increased cost will push prices back down. For my money, I wouldn't count on it. The Fed has demonstrated in the last 6 months that they are Über sensitive to not wrecking the hard won economic gains we are experiencing and housing recovery is central to the process. Further, if history is any lesson see the graphic below which demonstrates the last 4 economic cycles where we saw a rapid increase in interest rates, home prices actually went up! Part of the reason for this stems from the fact that the Fed raises interest rates as a balancing mechanism when the economy is good and people overall are doing well. While it is true housing will cost more and home buyers purchasing power erodes when rates go up, it has not been true in the past that it causes prices to go back down.
Let me know if you have any questions or comments – It's always great to hear from you!
December 2013 Pierce County Housing Report
Month over Month Down + Year over Year Up = Just right!
What's ahead for 2014 and how long will distressed properties continue to play a part in Pierce County?
The Pierce County Housing Market took a breather in November when compared to the month before but the Year over Year stats continue to impress as we finish up 2013.
Here are the year over year numbers:
Inventory – UP slightly at 2.2%
Closings – Even up 0.5%
Months of Inventory – Even last year 4.1 this year 4.2
Median Price – UP 2.5%
All of the aforementioned numbers are Down from last month, notably the drop in Solds when compared to October was -18.3%. As I reported in my last installment; October benefited from upward lift created by the ending of the government shutdown. We can conclude while 18.3% is a hefty drop, the sky is not falling and big picture numbers look good!
Transaction Velocity For several years I have said that the market recovers in two ways – and one is always before the other. First is transaction velocity. The transaction velocity, or volume, is the total number of units sold. This velocity must come back into line with the traditional norm before we can have a full recovery and further price appreciation. Now that 2013 is nearly in the books we can project Pierce County transaction velocity will come in just under 11,000 units. That compares to a 12 year pre and post bubble average of 12,749 . The chart below illustrates the fluctuations. Velocity for 2013 will be 12% greater than 2012 and that was accomplished with a relative short supply of inventory during the Spring and early Summer season. In 2014 Pierce County transaction velocity is expected to increase at least another 12% over 2013. That will bring the transaction velocity completely in line with the 12 year average.
Prices and Distressed Properties We are in a solid place for continued appreciation with transaction velocity approaching pre-bubble levels. Pierce County has also recorded 6 straight Quarters of Year over Year median price increases. Using the November median price of $205,000 Pierce County prices have increased 8% year to date, which is interesting because in August we were up 18.4%. One of the culprits preventing more robust increases in our area might be the quantity of distressed properties. As I discussed in October's report, distressed properties are either short sale or bank owned properties. In Pierce County 25% of the listings are distressed and nearly 1 out of every 3 real estate sales (32%) are distressed. As a percentage of volume, Pierce County has roughly twice the amount of distressed sales when compared to King County where 17% of the listings and 15.8% of the closings are distressed.
King County's distressed properties for sale equals a 2.5 months supply. Pierce County has 3.2 months which isn't that much worse. I don't want to over complicate but most of my stats come from the NWMLS….Pierce County has experienced heavy buying activity from numerous hedge funds snapping up hundreds of units that would otherwise be visible and counted here as additional distressed units Since those acquisitions don't hit the MLS we don't see them. According to CoreLogic the Washington State average of distressed inventory is between 6-8 months and you can see on the chart below how that compares nationally. As we work through 2014 we will be watching for the flow of distressed properties to eventually slow and this will signal even greater appreciation ahead.
We are wrapping up this year in a much different place than we were a year ago. Instead of hopeful optimism of a full recovery in the housing market we have many solid statistics to assure the trending is real, the bottom is well behind us, and real estate is showing itself once again to be one of the best long term investments available to all of us.
As real estate professionals we recognize there are still many Pierce County households who remain in recovery mode, for those, 2014 should bring relief with further price increases. For investors, the flow of distressed properties is an opportunity we may not see again for a long time. For those who would like to move up to a larger home, a waterfront, or a view home, ponder these elements:
– Mortgage rates remain at an all time low
– Pierce County prices have not yet fully recovered
– The market fundamentals strongly indicate "this recovery has a future".
Add it up and your next home can be bought with the confidence that it will be a rewarding investment.
November 2013 Pierce County Housing Report
An upward POP in Pending Home Sales as Prices settle!!
The Pierce County Housing Market saw an uptick in Pending sales last month setting the stage for a strong finish to a year that has been a big relief to many homeowners and brokers throughout the area. Let's look at the key "Year over Year" numbers:
1. Inventory – Basically Even up 0.5%
2. Closings – UP modest 3.1%
3. Months of Inventory – Even at 3.9 – Was 4.0 one year ago.
4. Median Price – UP 10%
5. New Pending Contracts – UP 11.9%
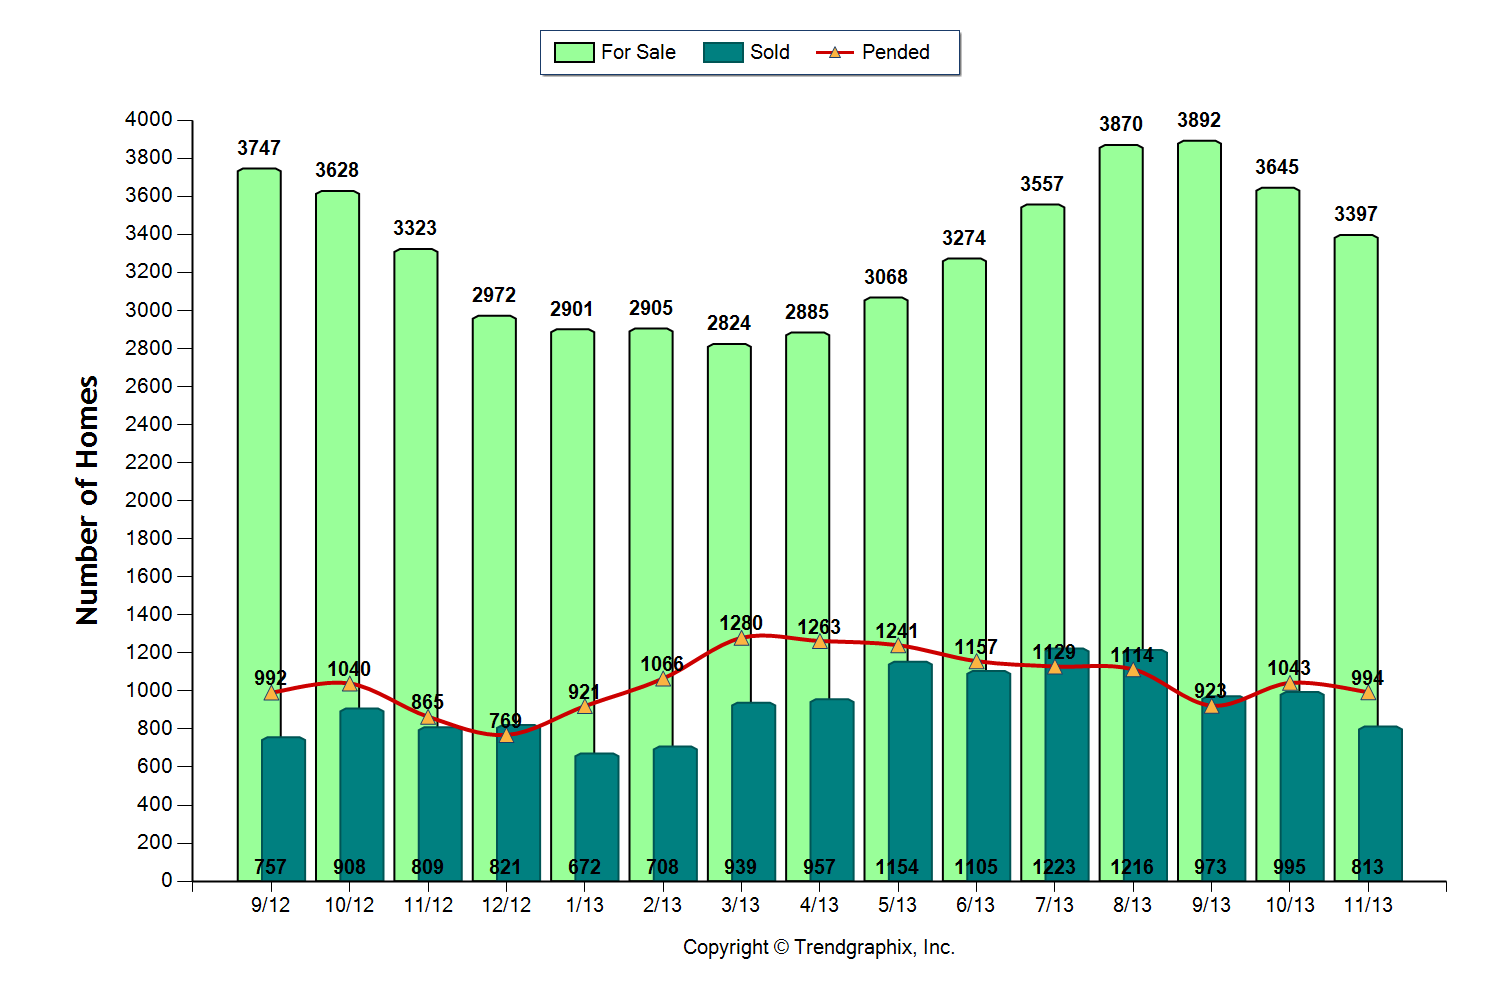
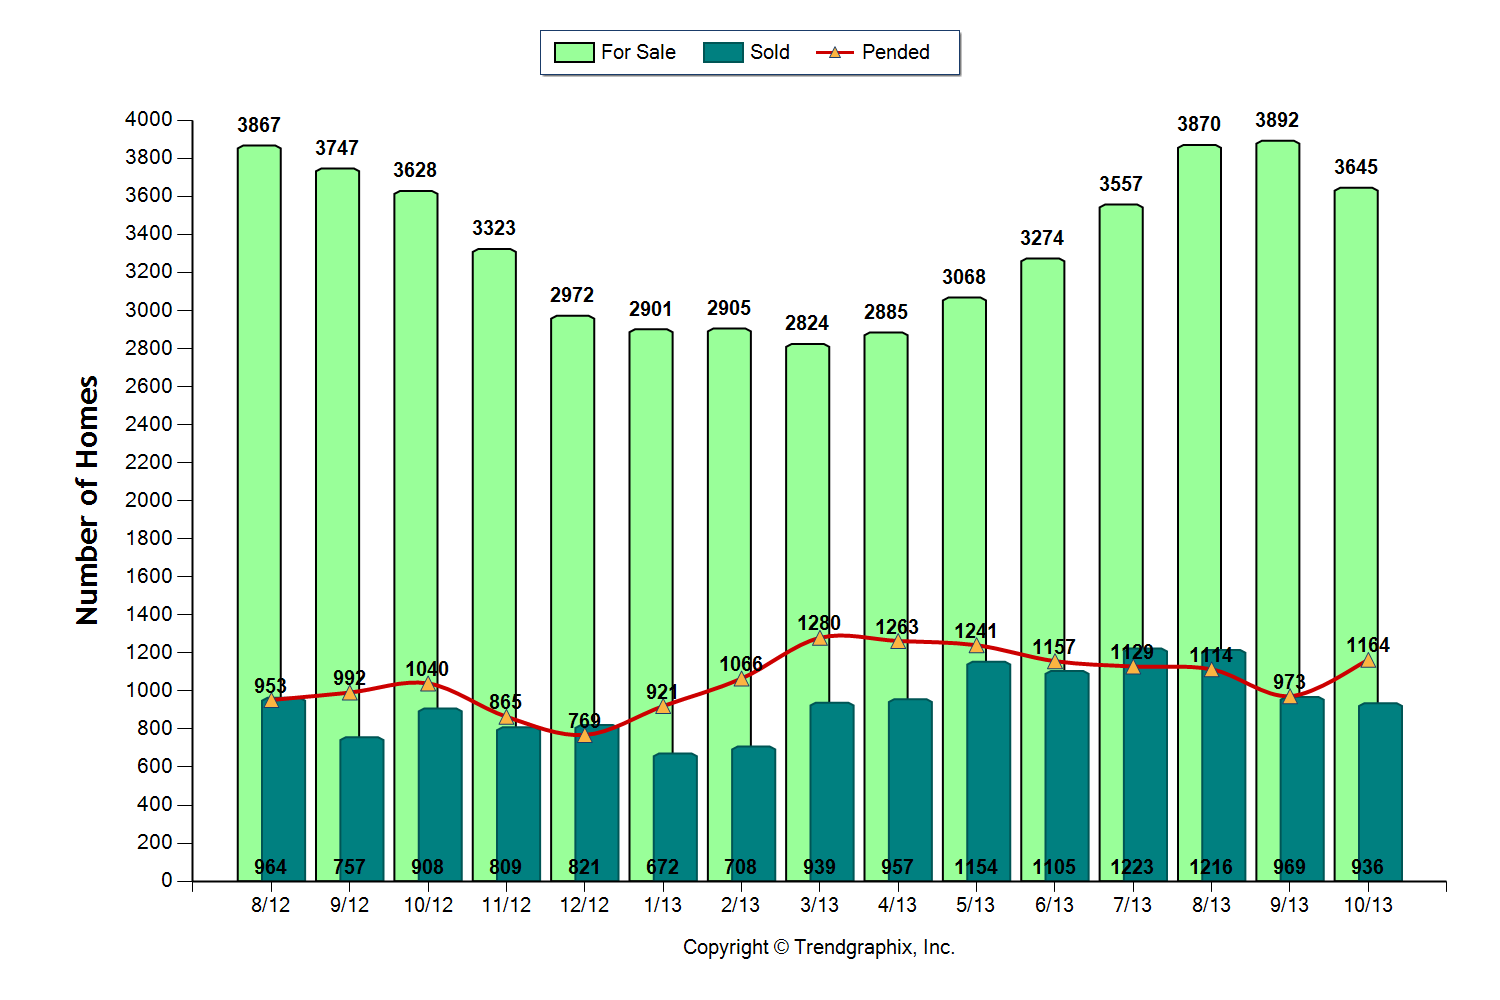
The jump in Pending Contracts is encouraging because it comes at a time typically regarded as the beginning of a seasonal drop in activity. At 1,164 Pending Contracts, it was most activity we have seen in a single month since May earlier this year! It's likely some of the extra activity was a bounce from the government shutdown ending, but a nearly 12% pop is welcome and shows us this market still has a foundation with solid demand.
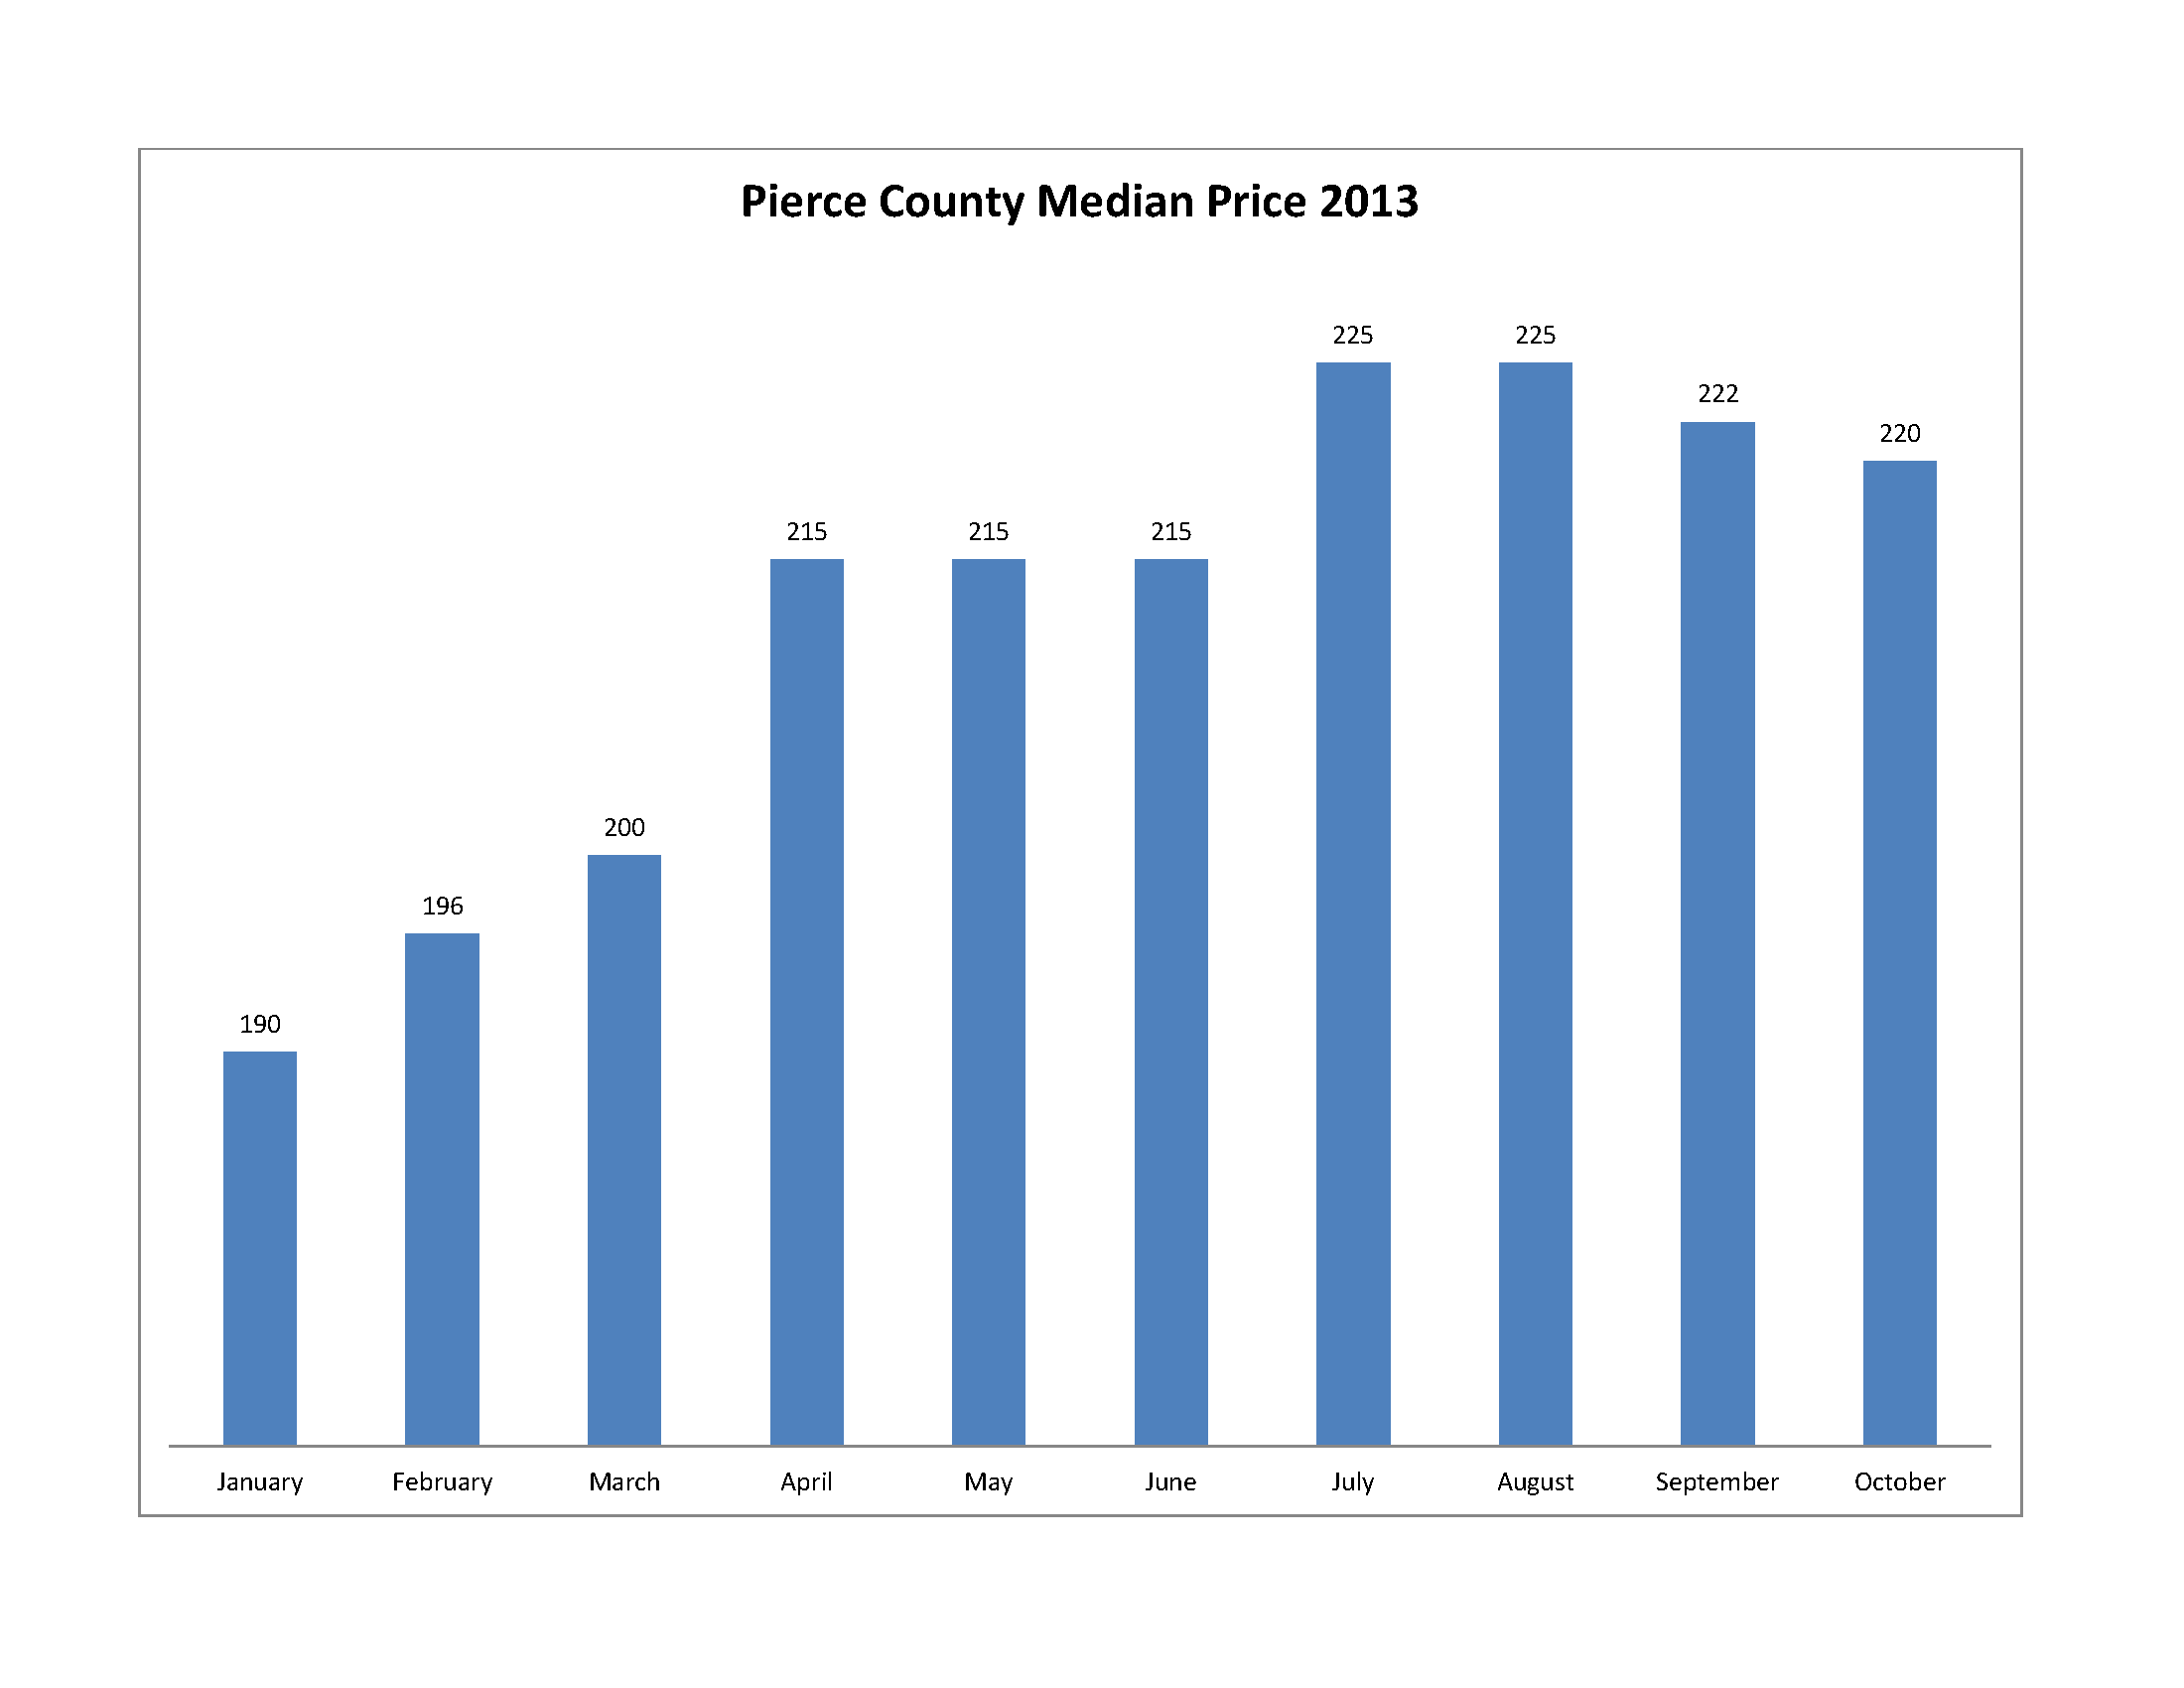
Pricing has Calmed Down. This is a positive trend for maintaining housing demand and keeps affordability from eroding. At $220,000 median closed price, we are down month over month for the 3rd month in a row and we are 5% below the 2013 peak seen in July and August. The moderation helps Pierce County buyers and sellers feel more comfortable with their decisions to buy and sell. A balanced market puts both camps at ease; it allows the participants to make decisions while "breathing through their nose" and not feeling frantic.
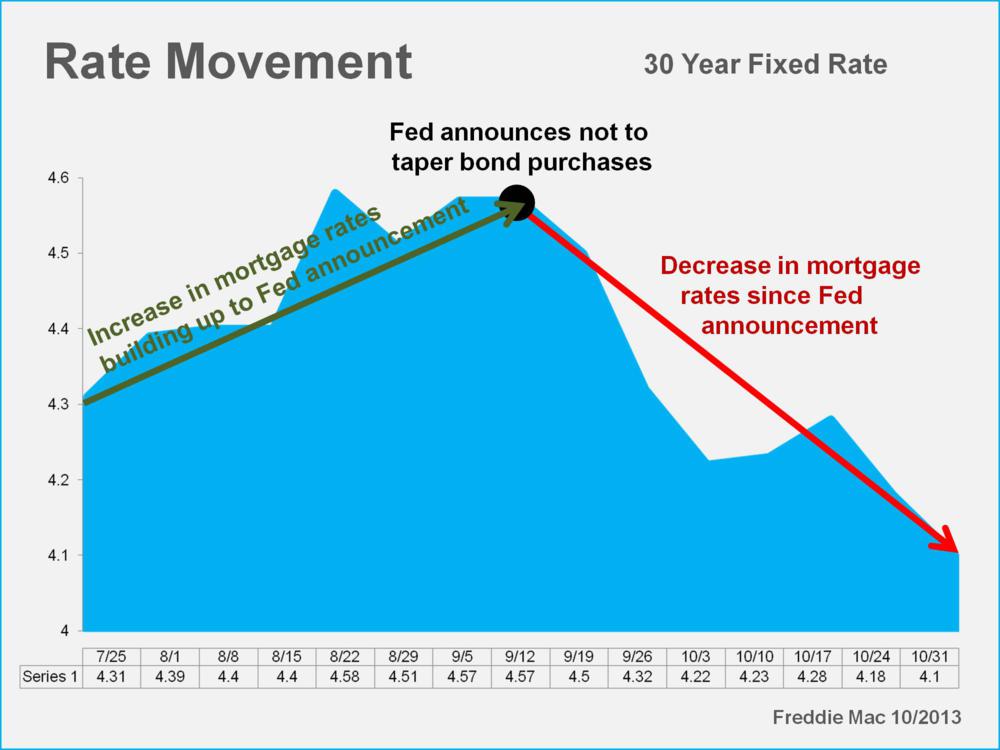
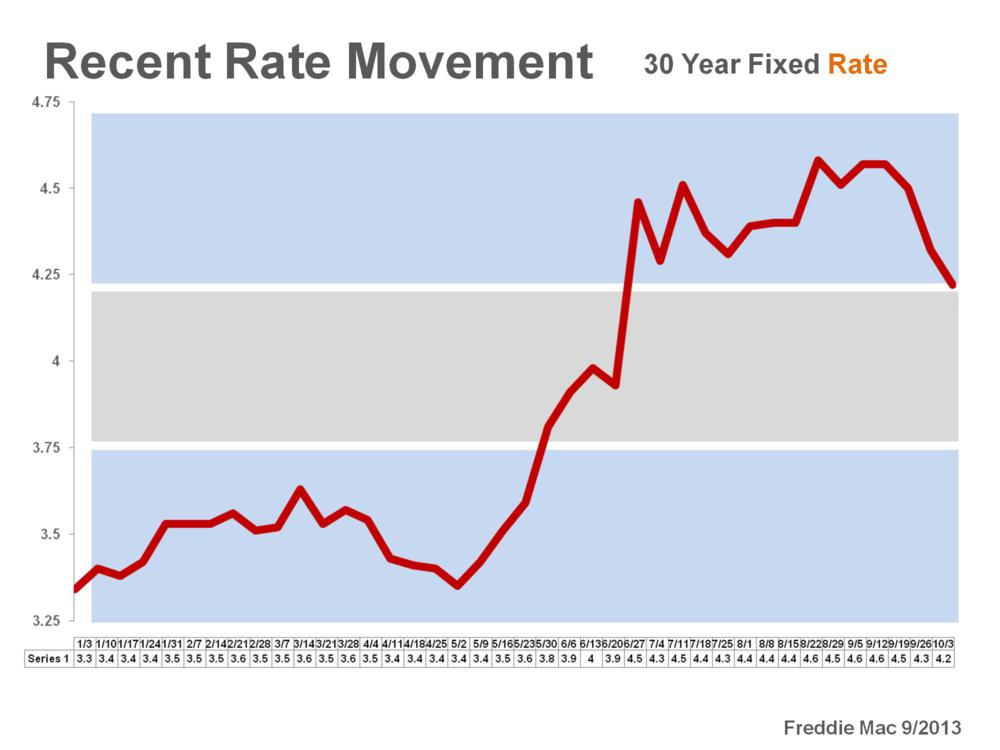
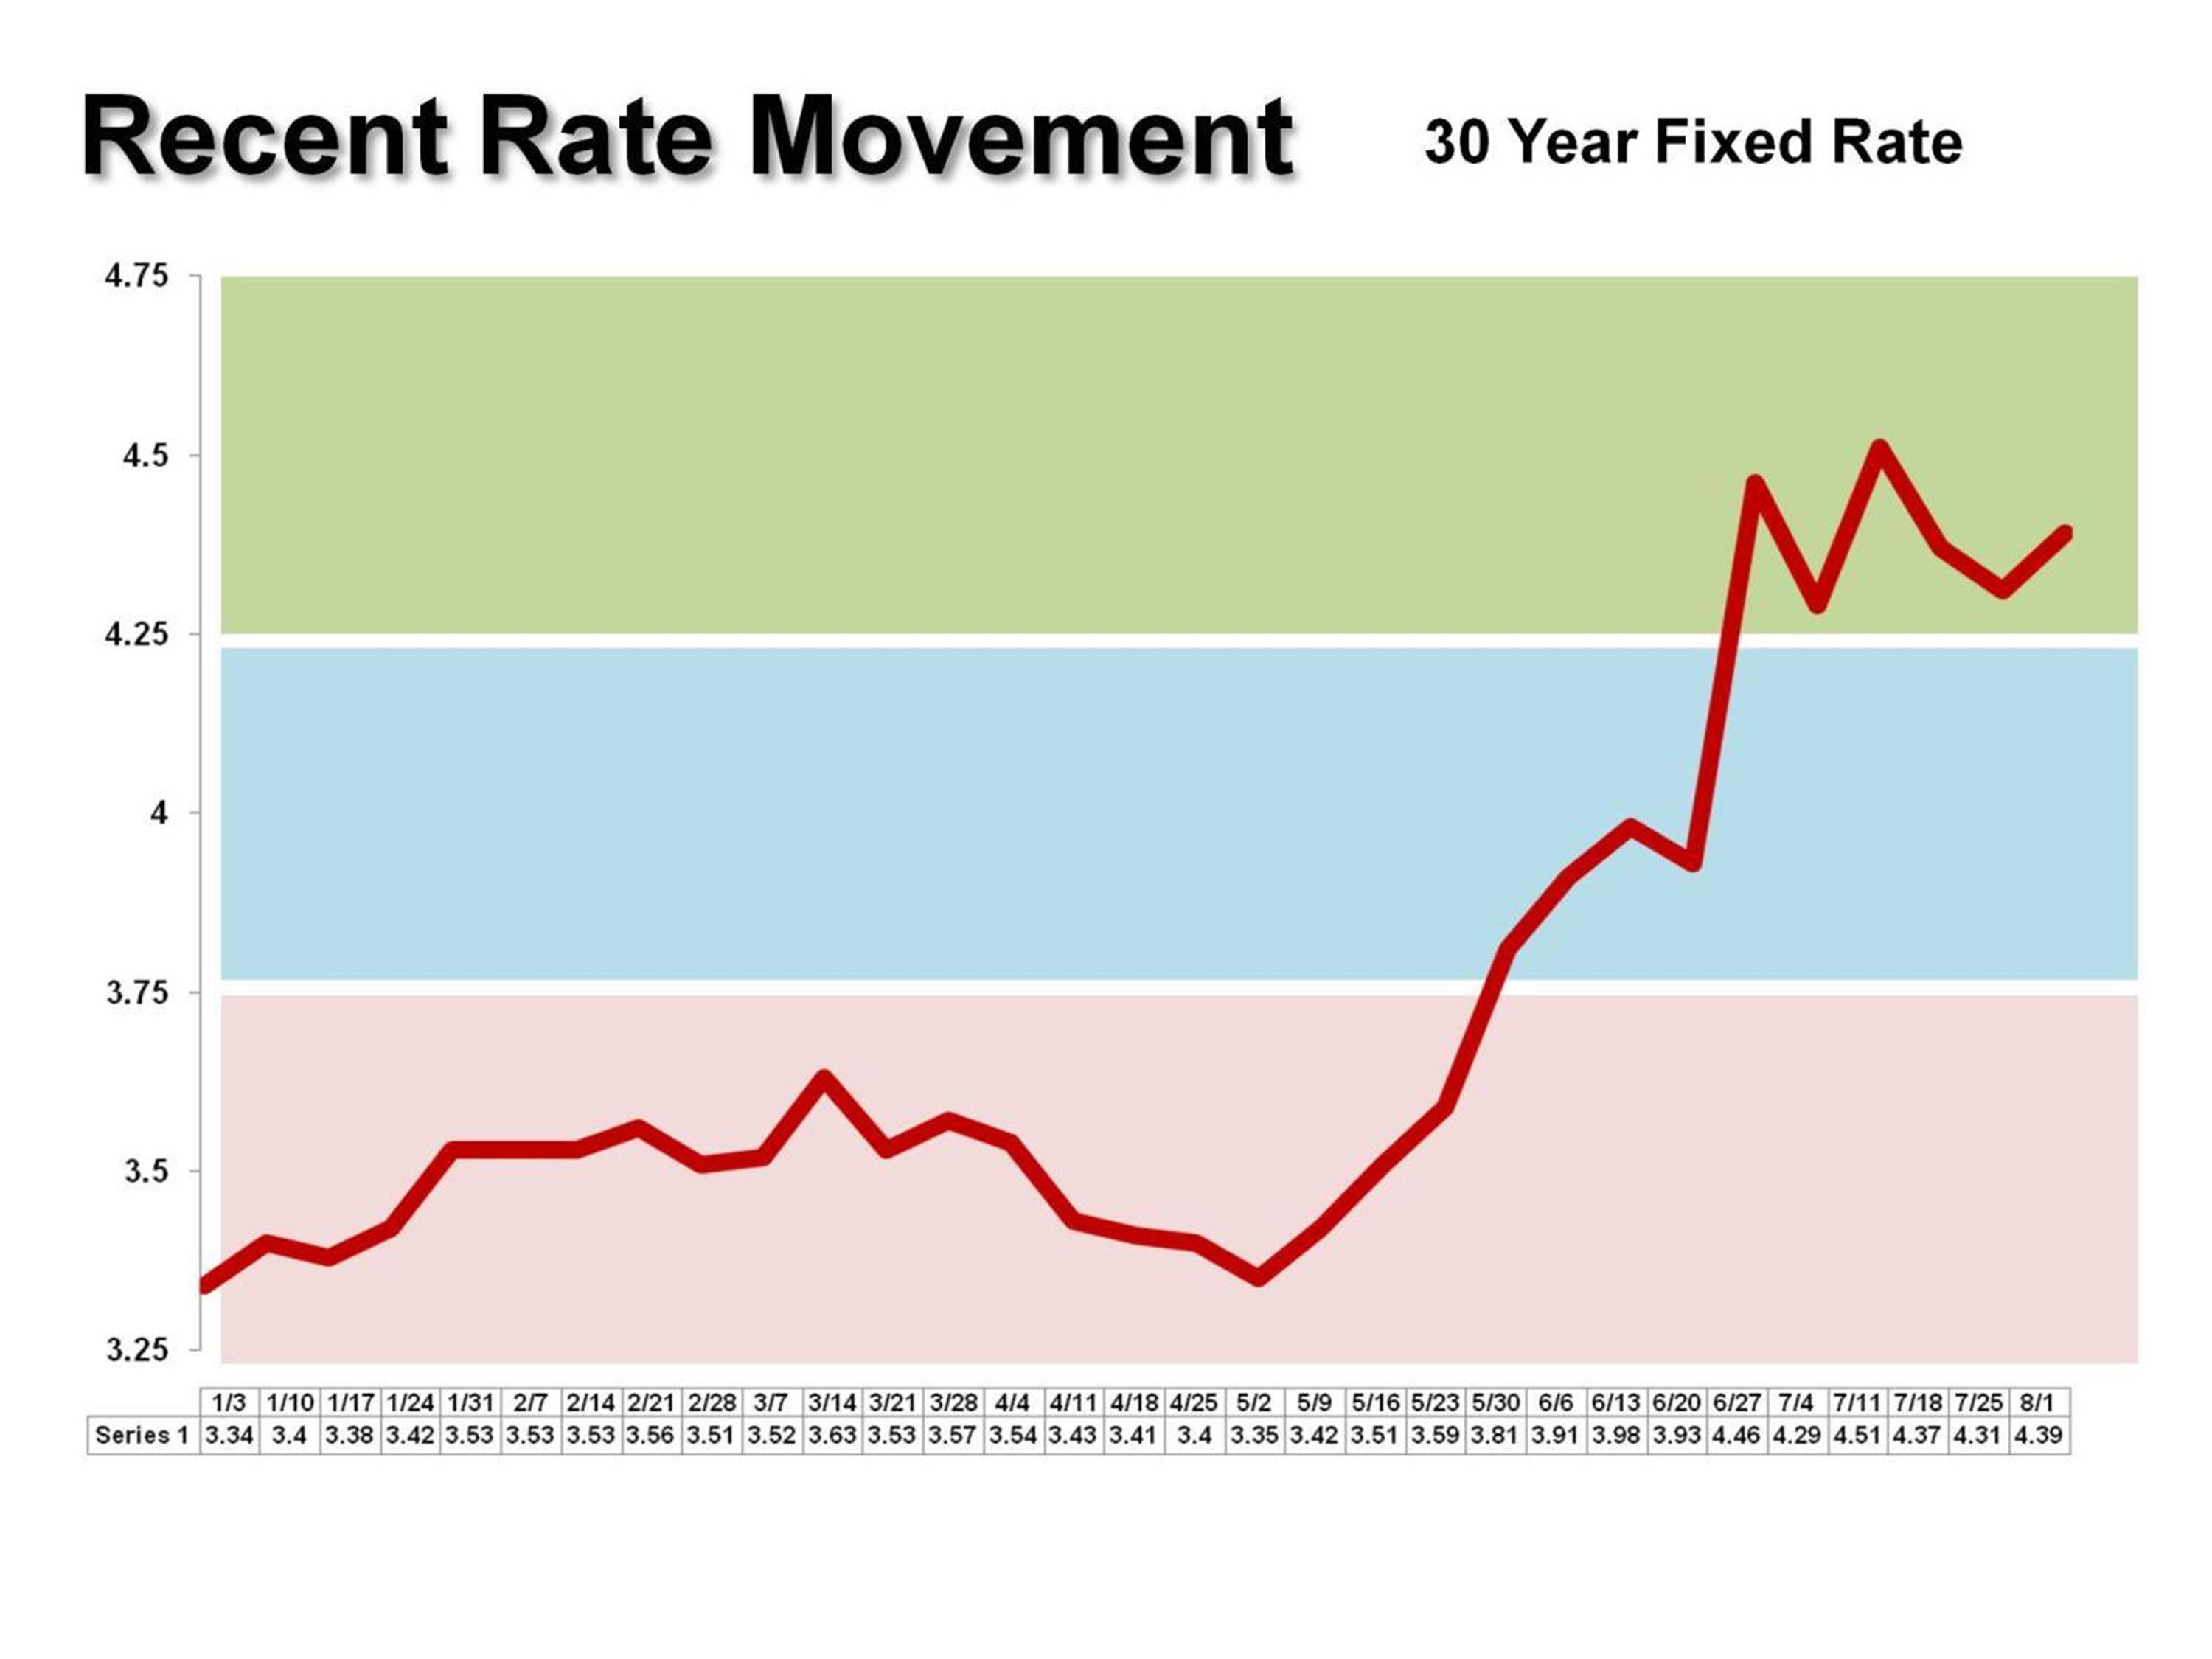
Interest Rates Bouncing of 4% Floor. Last month we observed how just the hint of Federal Reserve tapering bond purchases had pushed rates up a full point earlier in the year. When they announced "not yet" in September, we saw rates fall back to 1st quarter levels as the chart below demonstrates. Few economists, traders, mortgage brokers or cab drivers believe this phenomenon can go on too much longer. Nobody knows for sure, but all agree at some point in the (possibly near) future rates move higher. Most people include a mortgage in their home buying, so when rates go up the "cost" of housing goes up. The thought here of course is that if there is a mortgage involved in the next move, "sooner is probably better than later".
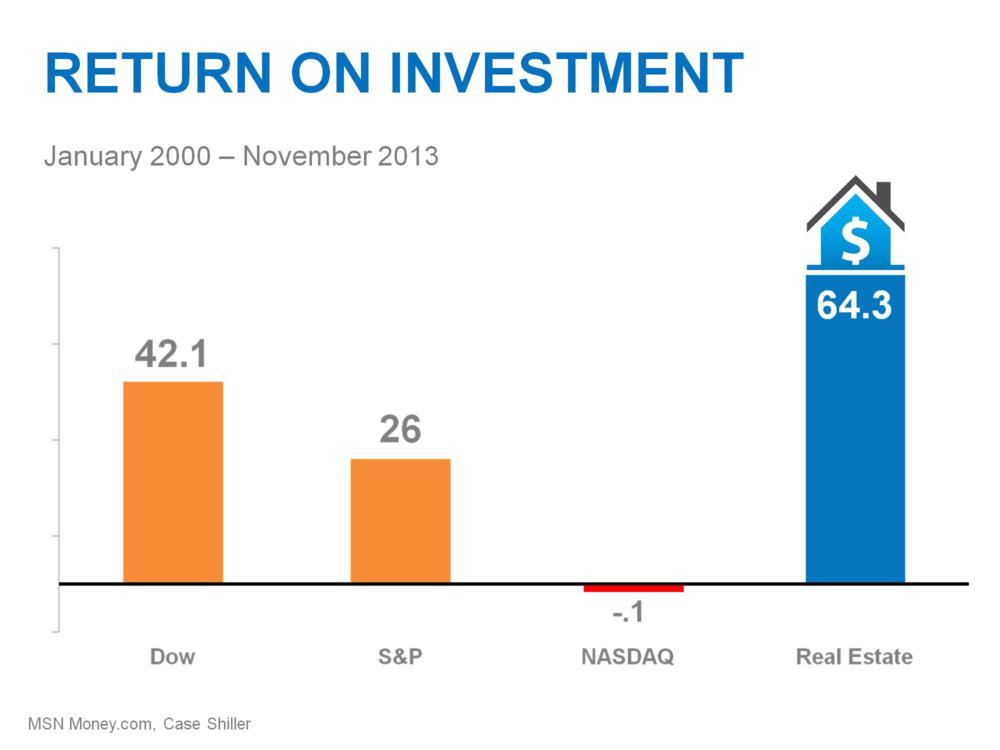
Home Price Expectation Survey. A nationwide panel of over one hundred economists, real estate experts and investment & market strategists have issued their 2013 4Q report. The aggregate of all projections expect cumulative appreciation to be 28% by year 2018. The panel suggests 2014 will see appreciation of 4.3%, significantly slower than the 2013 pace, and returning to a balanced 3.4% – 3.6% in years 2015 – 2018. These projections of course will differ for our more localized Pierce County Market but the data is worth noting because it is not just one economist or real estate professional but an average taken from a much larger group of experts. As these appreciation numbers play out we will see real estate continues to be one of the best long term investments to participate in. The chart below shows the national return on real estate over the last 13 years. Even with the run up and painful correction taken into consideration real estate proves to be one of best long term places to invest.
Windermere Foundation donations up 21% from this time last year!
Windermere Foundation has raised over $1,074,482 this year! It feels good to work for a company that makes community such a priority. You can see the full article at http://www.windermere.com/blogs/windermere-foundation/posts/windermere-foundation-quarterly-report–8
October 2013 Pierce County Housing Report
Three factors aligning for a great market opportunity!
The Pierce County Housing Market is continuing the "normalization" process (yawn) but as usual there's a few interesting stories within the numbers that are worth paying attention to. First, here are the basic numbers I like to follow:
1. Inventory – UP 3%
2. Closings – UP 23%
3. Months of Inventory – DOWN at 4.2 – Was at 4.9 one year ago.
4. Median Price – UP 8.3%
5. New Pending Contracts – UP 8%
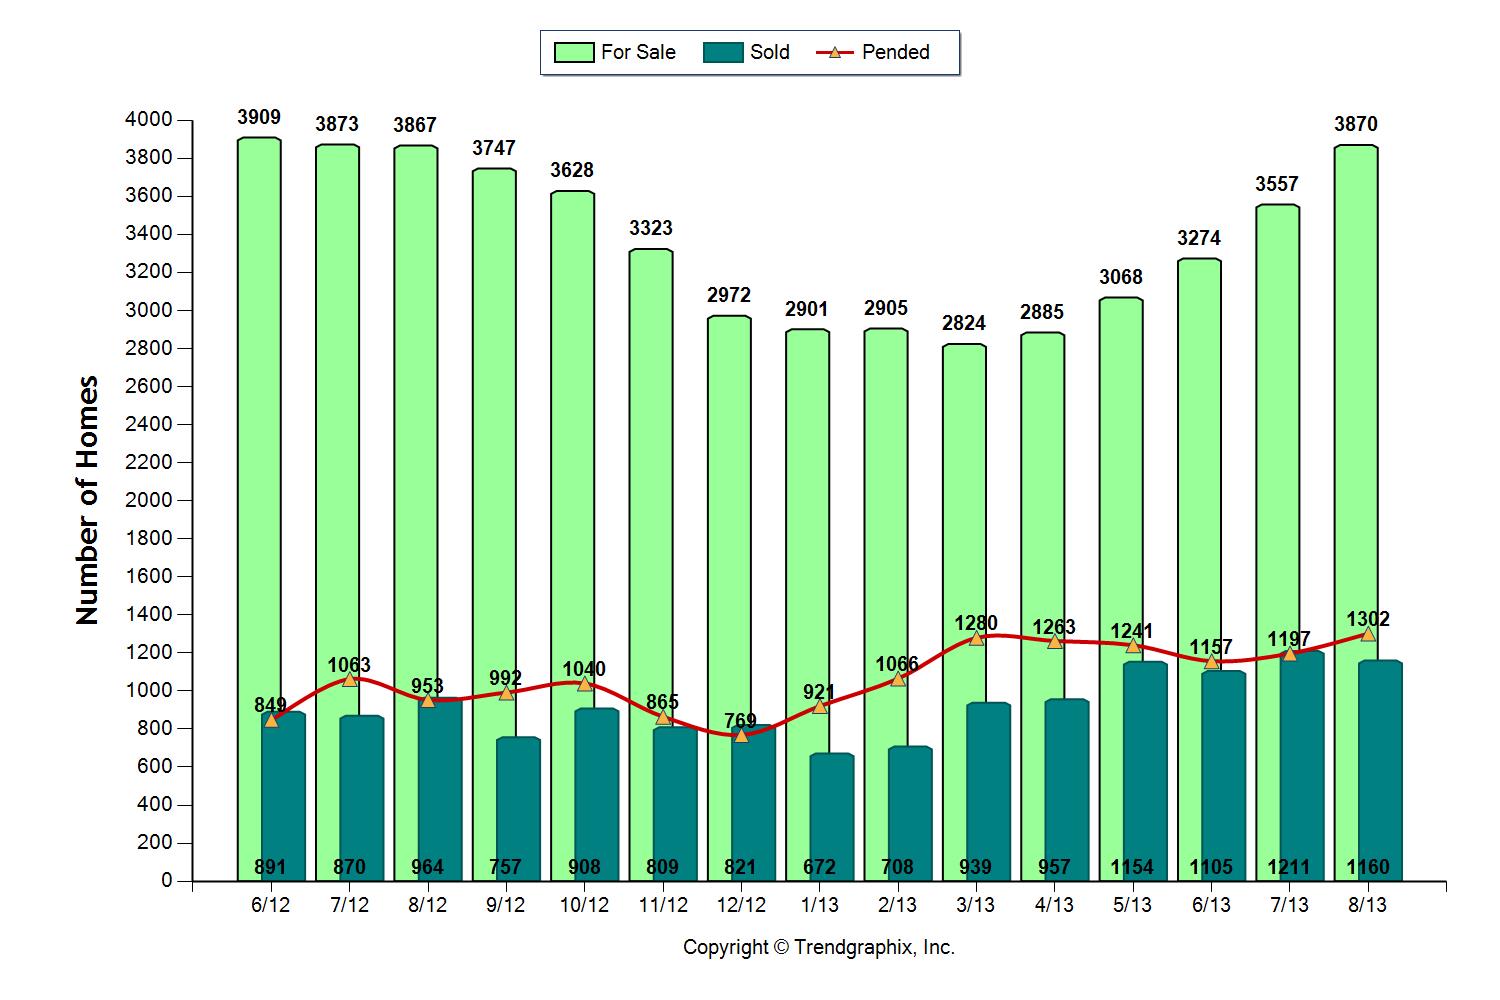
Here's what I find INTERESTING….Inventory is the highest it has been since Springtime 2012. We actually had about the same number of closings last month as we did in February of this year, but at that time we had 33% LESS inventory! This shows the calming of the market I've been talking about in last few reports.
ONE MORE PERSPECTIVE to consider about the Pierce County inventory. Fully 23% of homes for sale are DISTRESSED, meaning they are either BANK OWNED or SHORT SALES. With nearly a 1/4 of our inventory distressed we are significantly above the National Average of 12%. Pierce County real estate is still working through some painful remnants of the big recession. By the way, King County is about the same as the National Average at 12.7%, so we can keep that in mind when listening to local media.
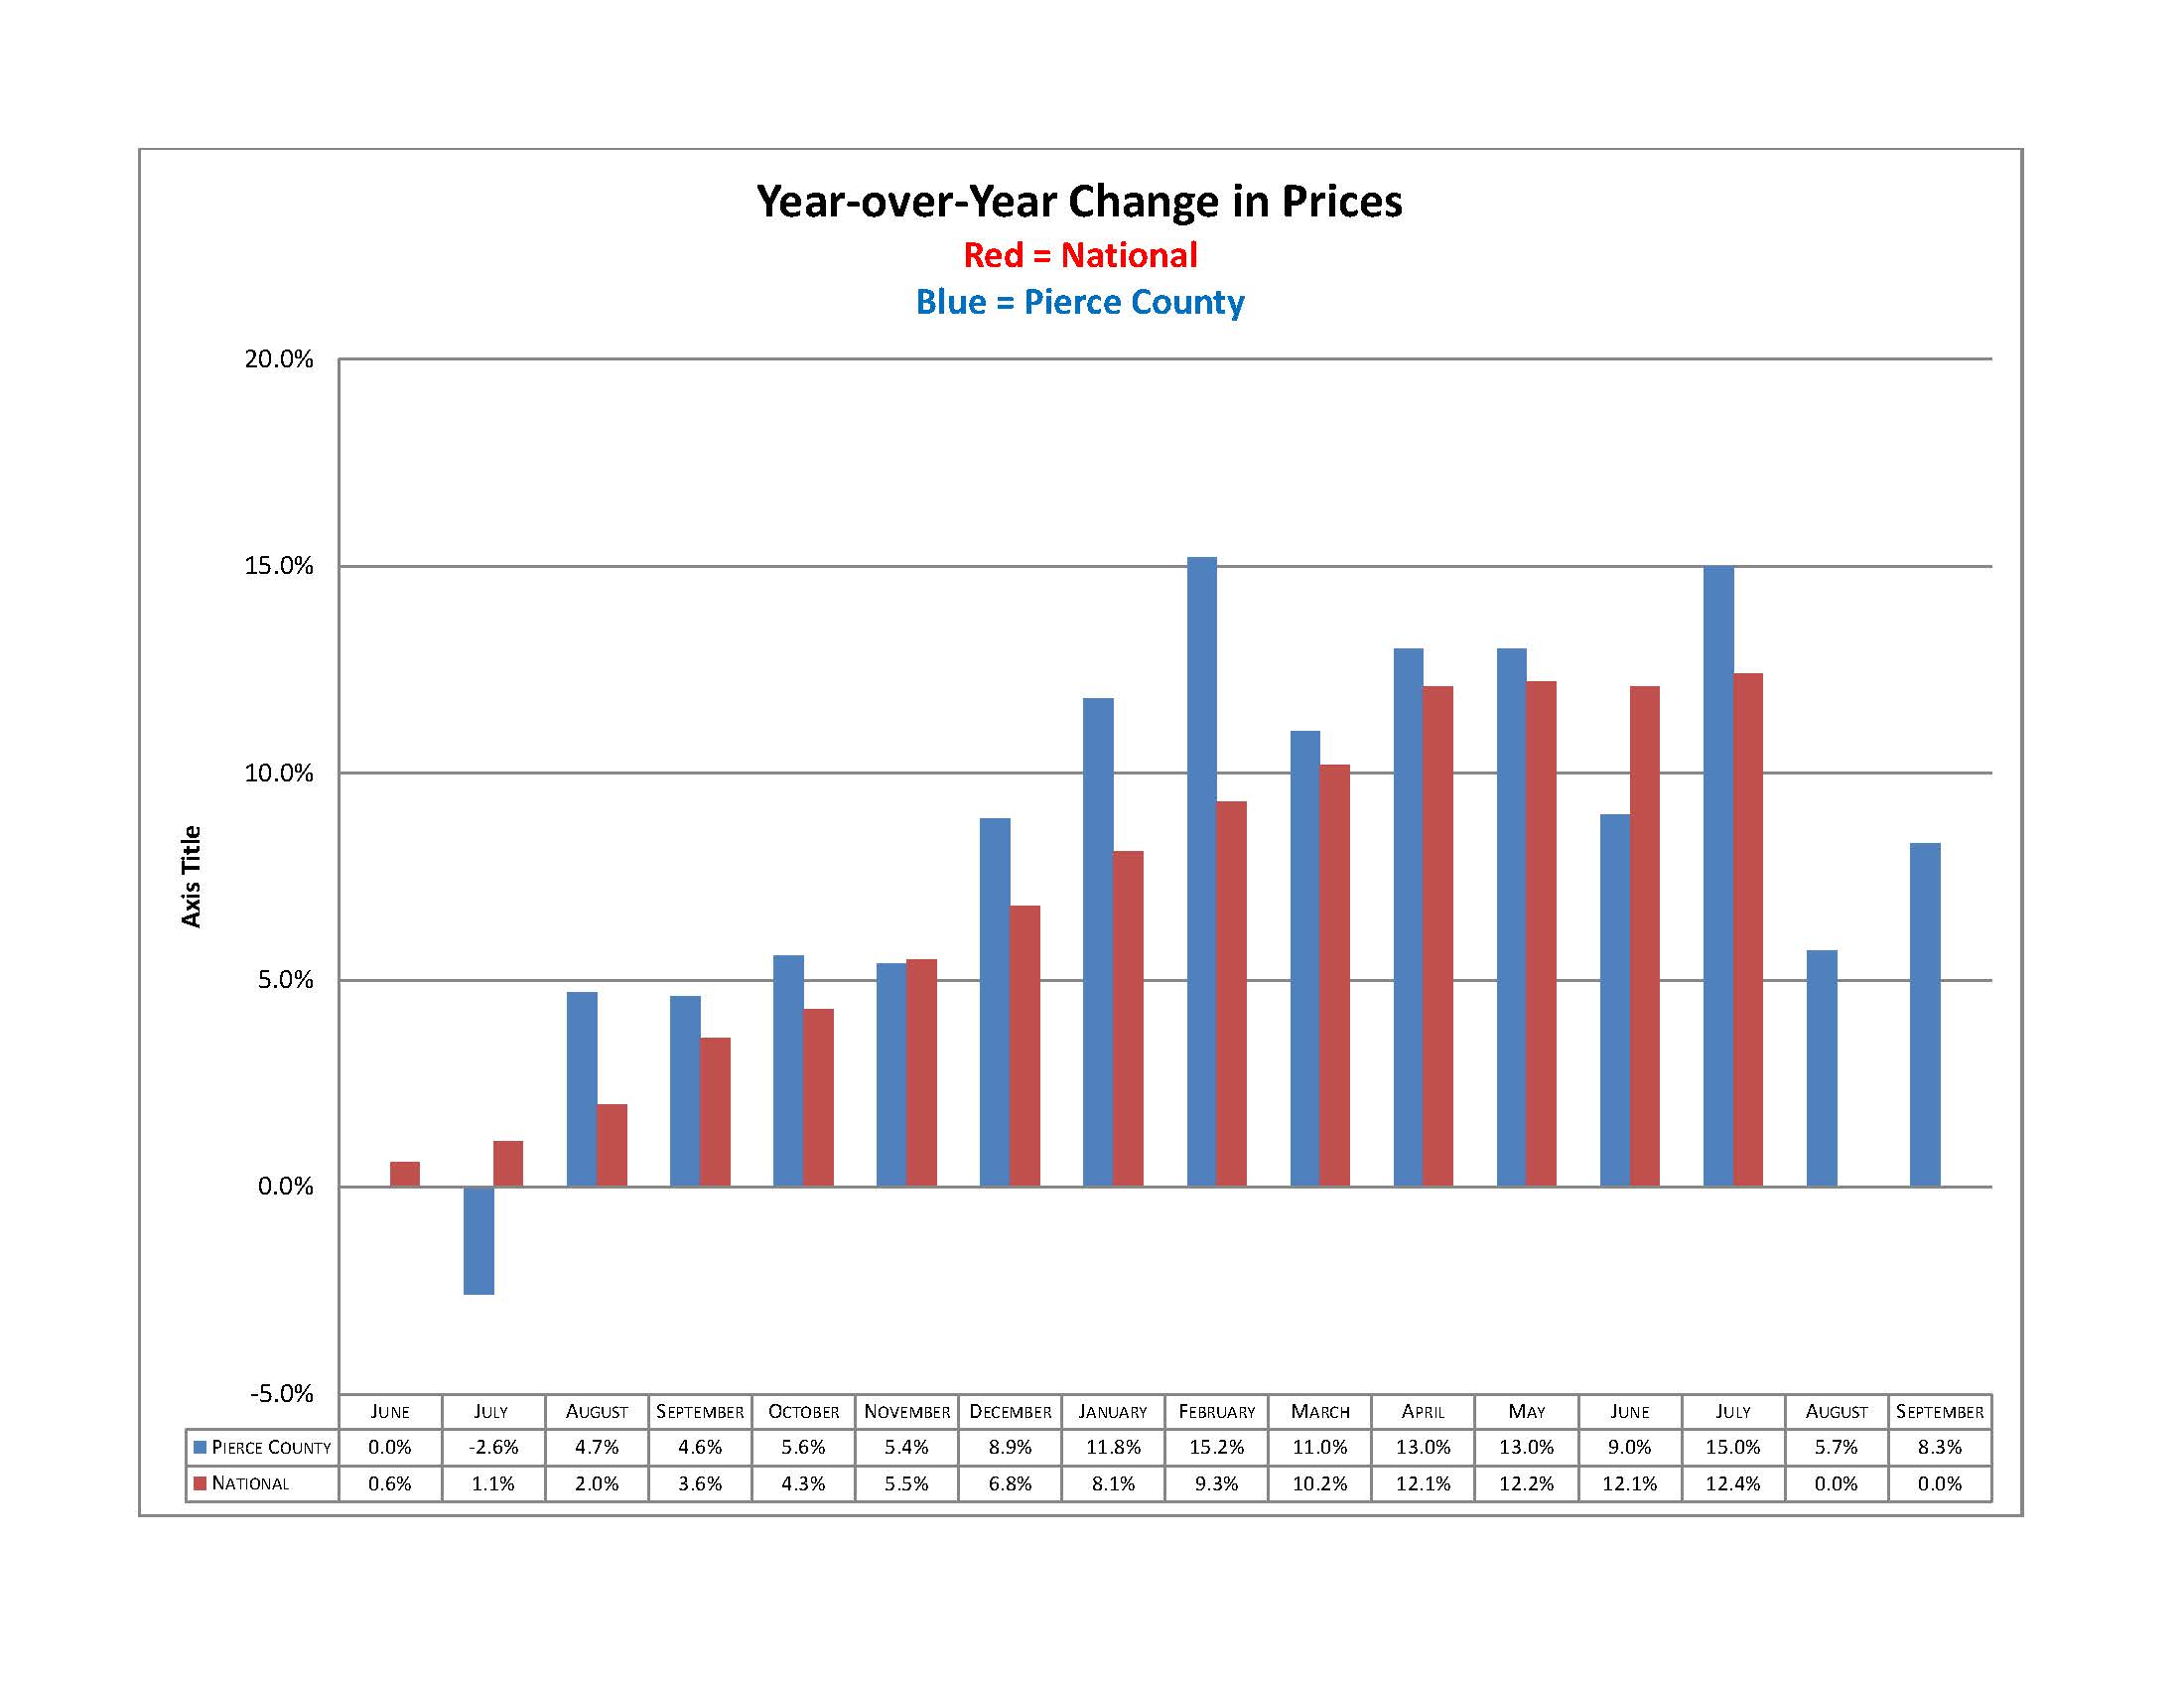
As you can see above, the BIG STORY is the leveling of price increases, we are pretty much in line with National Averages. With the increased level of inventory and stable demand for housing it is creating a moderation in the pace of home appreciation. This will be good for the health of the market overall and in the long term. This graph of year over year prices both Nationally and here in Pierce County shows the market finding equilibrium.
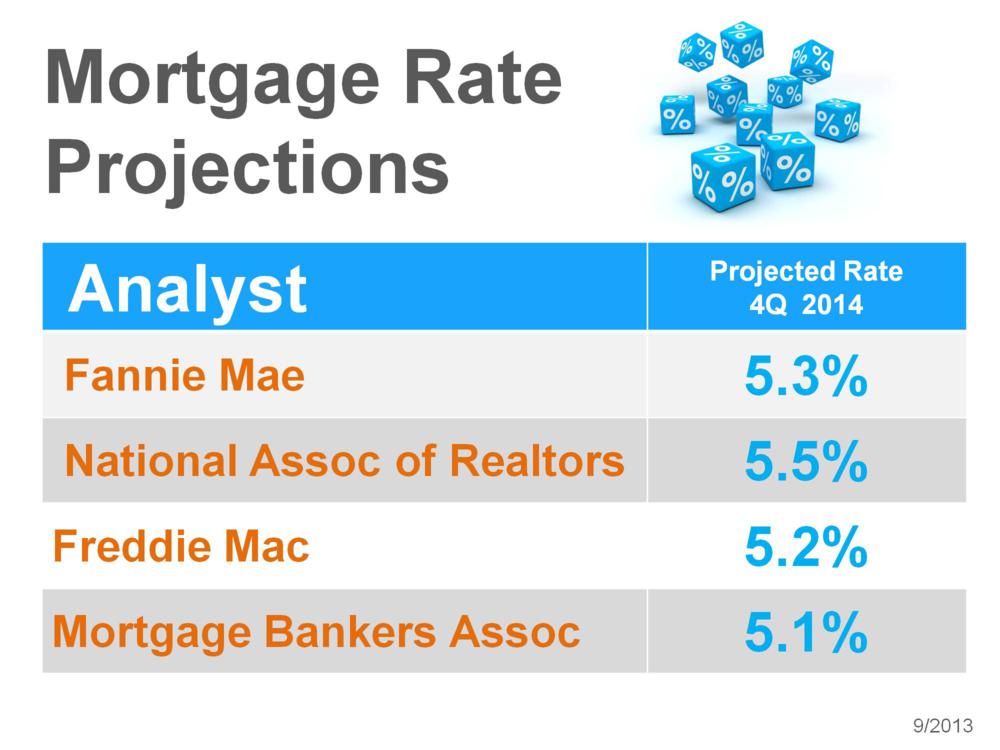
The WINDOW OF OPPORTUNITY. Recently, when the Fed Chairman somewhat unexpectedly announced there was no immediate plans to stop the purchasing of treasury bonds and mortgage backed securities, interest rates moved down. This reversal of the rising rates we have seen most of this year is not expected to last. As the economy finds it's foundation and eventually the Fed does start its tapering we will certainly see higher rates and look back at this moment as a golden opportunity. This chart shows where 4 expert organizations forecast interest rates to be in one year from now.
Add it up
1.) Calming Market
2.) Distressed Inventory is 23% of the Pool and
3.) An unexpected dip in rates!
We live in a great area with a great future, and Pierce County Real Estate will be a rewarding place to be in the coming years. It's not as easy as it was 6 or 8 months ago but there's still some great bargains out there and with a second look at some of the lowest interest rates in decades the window is open to secure that move up home, first home or investment property.
September 2013 Pierce County Housing Report
5 Data Points You’ll Want to Know and What’s Ahead!
With last week’s storms it appears the weather is starting to turn a corner and it seems the Pierce County Housing Market may be doing the same! Take a look;
- Inventory – EVEN with last year.
- Closings – UP 27%.
- Months of Inventory – DOWN at 3.0. It was 3.9 a year ago.
- Median Price – UP 5.7%.
- New Pending Contracts – UP 11%
Sounds good, right!? Yes, it has been good, however as we dig deeper there’s more to the story. Pierce County prices in August were actually down from July by 6.3% and inventory was up for the 5th month in a row. Hmmmmm…. It is worth pointing out here that the media is working from July numbers so they are trumpeting a somewhat different tune. In July our market, along with the rest of the country, experienced the 6th month in a row of increased median price. As I began to elude in my report last month I’m suggesting our market is tempering.
With recent interest rate hikes along with the increased inventory levels buyers have shown behavior more consistent with a slower or normalized market. They are taking action, but only on properties that are priced and groomed with the market in front of us. The price gains we’ve seen will not continue to runaway. Both rising mortgage rates and slowly growing inventory will effectively tap the brakes on that trend. The good news is those factors keep us away from any “2nd Bubble” talk!
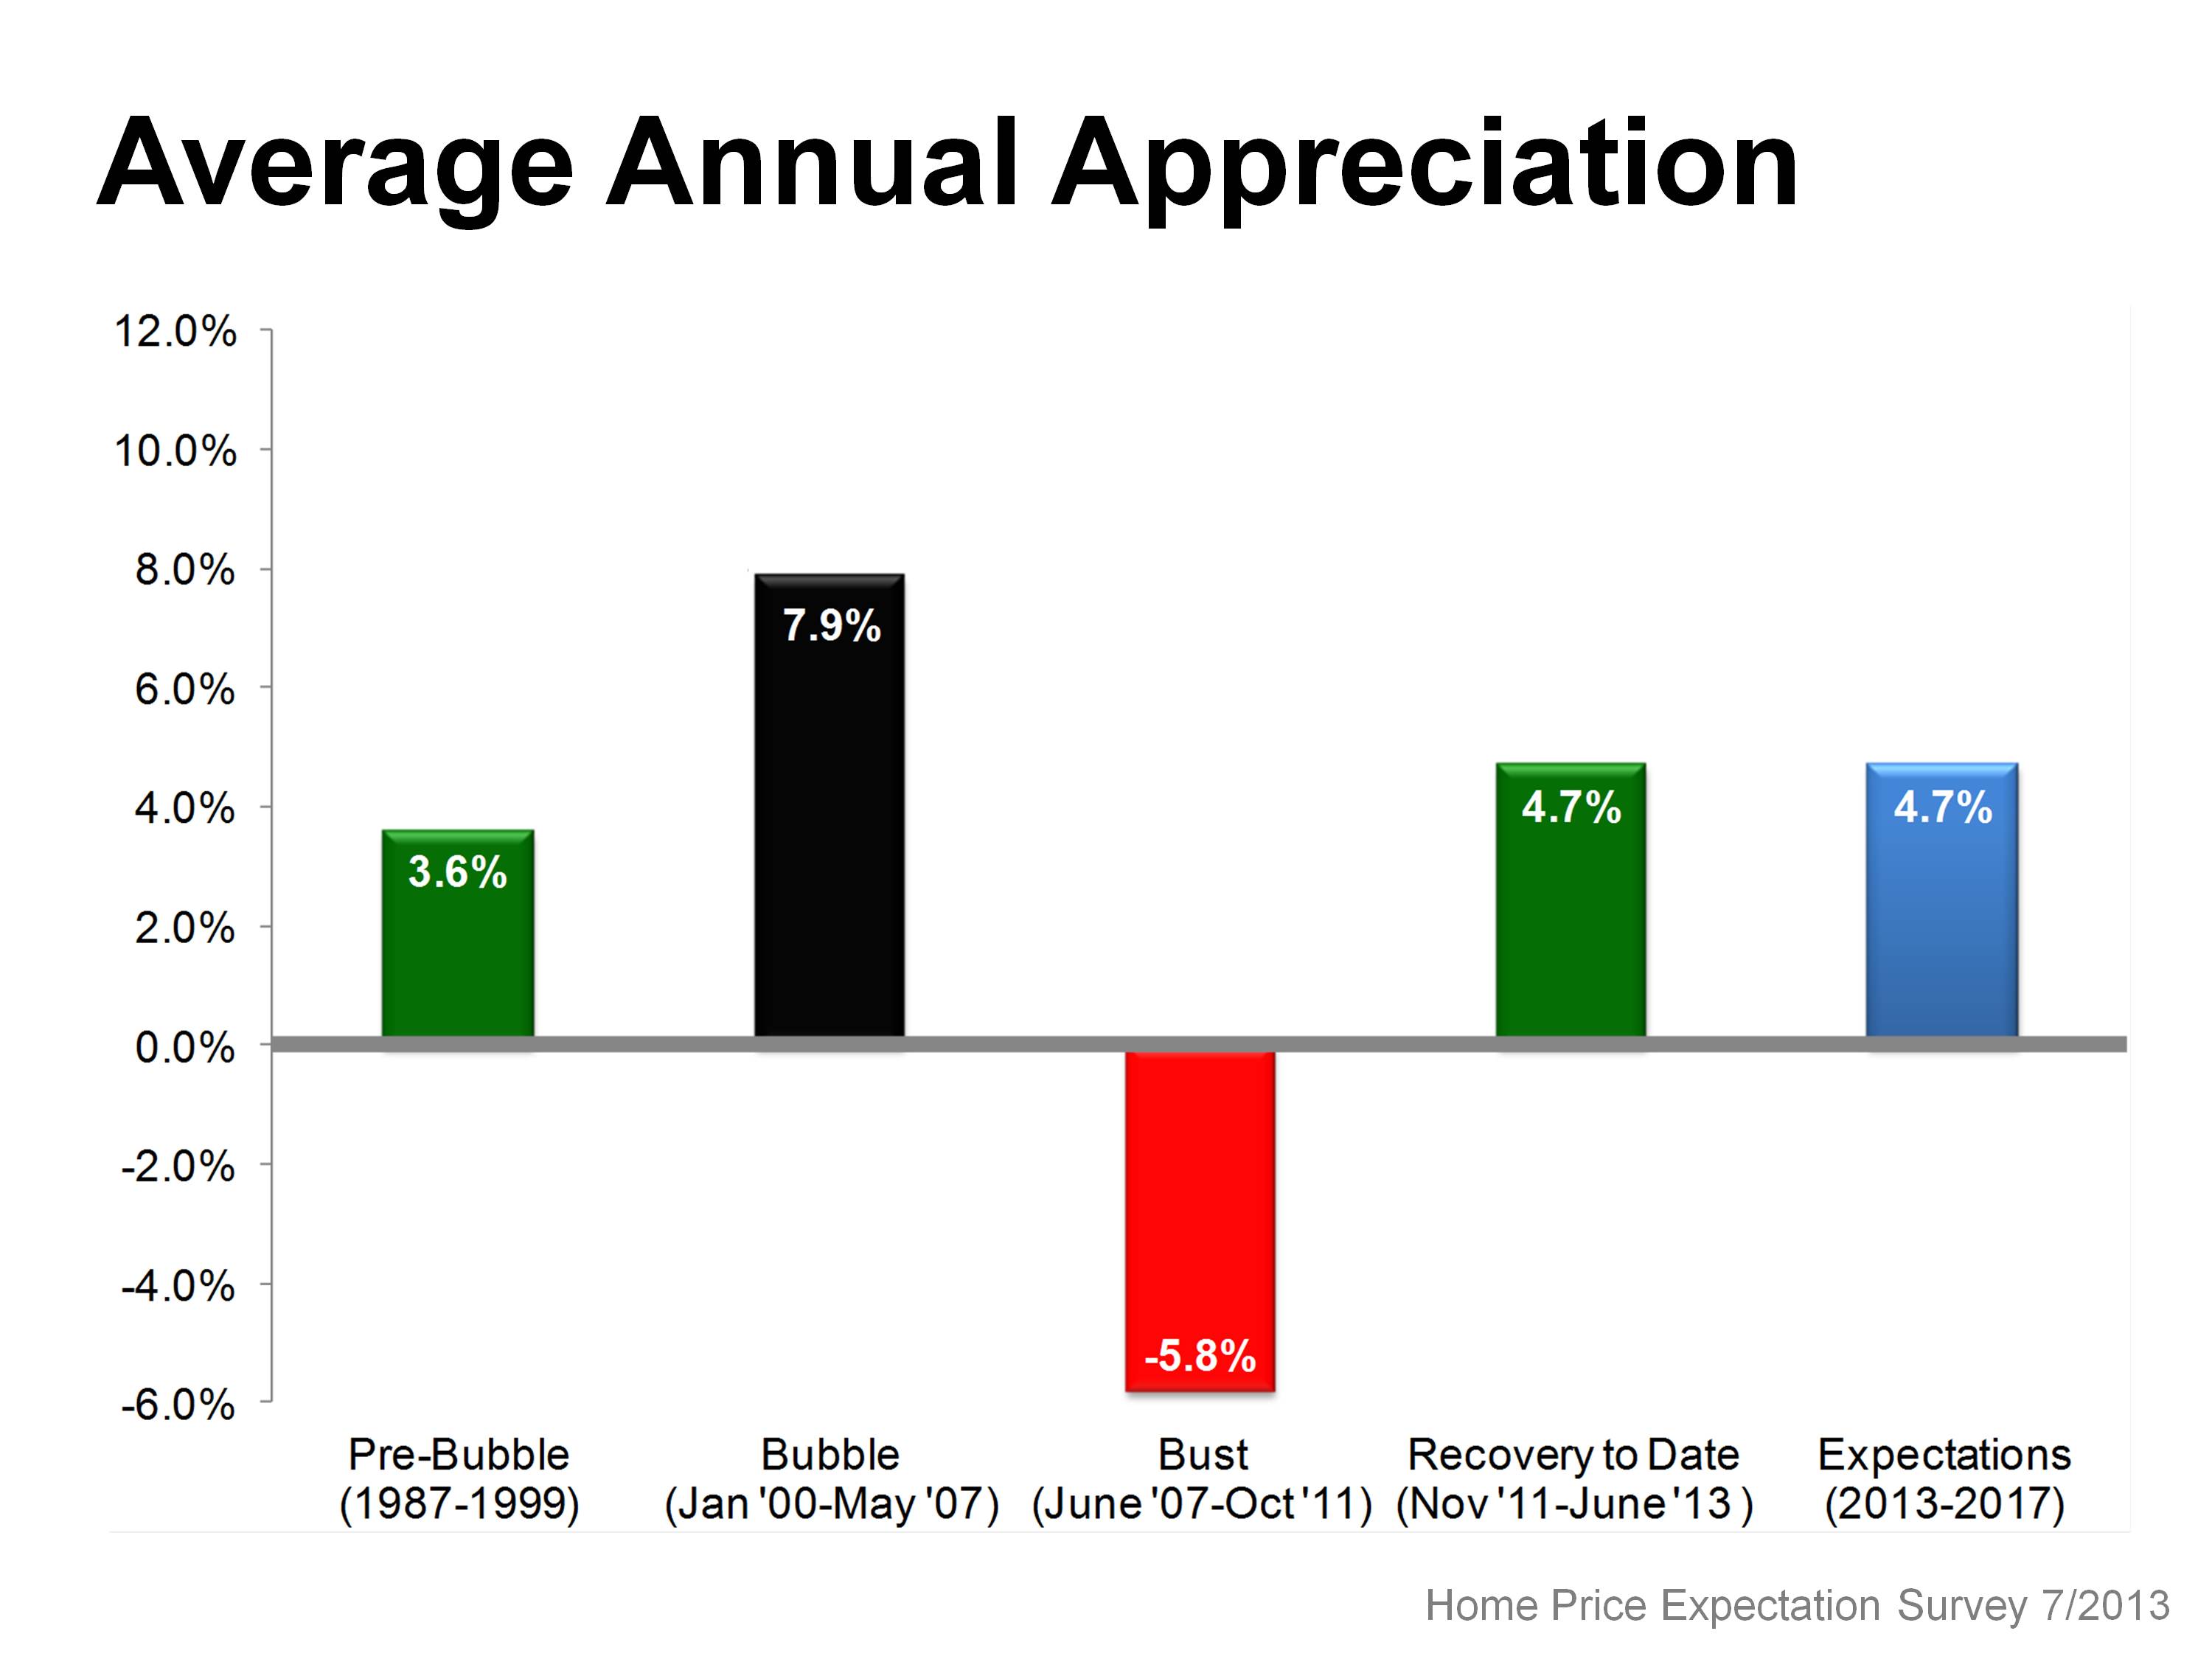
Real Estate is still a great place to be as we move ahead. The July Home Price Expectation Survey of 100 top housing economists predict the national housing market to appreciate each of the next 5 years at an annualized rate of 4.7%. The “pre-bubble” annual average was 3.6%. This quarterly survey is important because it is not just one economist making a prediction but an aggregate of over 100 economists, real estate experts and investment & market strategists.

 Facebook
 X
X
 Pinterest
 Copy Link
